Comparison of Models: Quality, Performance & Price Analysis
Comparison and analysis of AI models across key performance metrics including quality, price, output speed, latency, context window & others. Click on any model to see detailed metrics. For more details including relating to our methodology, see our FAQs.
Model Comparison Summary
Quality: GPT-4o and Llama 3.1 405B are the highest quality models, followed by Claude 3.5 Sonnet & Llama 3.1 70B.Output Speed (tokens/s): Mistral NeMo (188 t/s) and Gemini 1.5 Flash (166 t/s) are the fastest models, followed by Sonar Small & Llama 3 8B.Latency (seconds): Phi-3 Medium 14B (0.21s) and Sonar Small (0.23s) are the lowest latency models, followed by Mistral 7B & Sonar Large.Price ($ per M tokens): OpenChat 3.5 ($0.14) and Phi-3 Medium 14B ($0.14) are the cheapest models, followed by Gemma 7B & Llama 3 8B.Context Window: Gemini 1.5 Pro (2m) and Gemini 1.5 Flash (1m) are the largest context window models, followed by Codestral-Mamba & Jamba Instruct.
Highlights
Quality
Quality Index; Higher is better
Speed
Output Tokens per Second; Higher is better
Price
USD per 1M Tokens; Lower is better
Navigation
Parallel Queries:
Prompt Length:
Quality vs. Output Speed, Price
+ Add model from specific provider
Quality: General reasoning index; Output Speed: Output Tokens per Second; Price: Price: USD per 1M Tokens
Varied metrics by ability categorization; Higher is better
General Ability (Chatbot Arena)
Reasoning & Knowledge (MMLU)
Coding (HumanEval)
Different use-cases warrant considering different evaluation tests. Chatbot Arena is a good evaluation of communication abilities while MMLU tests reasoning and knowledge more comprehensively.
Total Response Time: Time to receive a 100 token response. Estimated based on Latency (time to receive first chunk) and Output Speed (output tokens per second).
Median across providers: Figures represent median (P50) across all providers which support the model.
Quality vs. Context window, Input token price
+ Add model from specific provider
Quality: General reasoning index; Context window: Tokens limit; Input Price: USD per 1M Input Tokens
Most attractive quadrant
Size represents Input Price (USD per M Input Tokens)
Quality: Index represents normalized average relative performance across Chatbot arena, MMLU & MT-Bench.
Context window: Maximum number of combined input & output tokens. Output tokens commonly have a significantly lower limit (varied by model).
Input price: Price per token included in the request/message sent to the API, represented as USD per million Tokens.
Context window
+ Add model from specific provider
Context window: Tokens limit; Higher is better
Larger context windows are relevant to RAG (Retrieval Augmented Generation) LLM workflows which typically involve reasoning and information retrieval of large amounts of data.
Context window: Maximum number of combined input & output tokens. Output tokens commonly have a significantly lower limit (varied by model).
While higher quality models are typically more expensive, they do not all follow the same price-quality curve.
Quality: Index represents normalized average relative performance across Chatbot arena, MMLU & MT-Bench.
Price: Price per token, represented as USD per million Tokens. Price is a blend of Input & Output token prices (3:1 ratio).
Median across providers: Figures represent median (P50) across all providers which support the model.
Pricing: Input and Output prices
+ Add model from specific provider
Price: USD per 1M Tokens
Input price
Output price
Prices vary considerably, including between input and output token price. Prices can vary by orders of magnitude (>10X) between the more expensive and cheapest models.
Input price: Price per token included in the request/message sent to the API, represented as USD per million Tokens.
Output price: Price per token generated by the model (received from the API), represented as USD per million Tokens.
Median across providers: Figures represent median (P50) across all providers which support the model.
Output Speed: Tokens per second received while the model is generating tokens (ie. after first chunk has been received from the API).
Median across providers: Figures represent median (P50) across all providers which support the model.
Output Speed by Input token (context) length
+ Add model from specific provider
Output Tokens per Second; Higher is better
Short (100 tokens)
Medium (1,000 tokens)
Long (10,000 tokens)
Output Speed: Tokens per second received while the model is generating tokens (ie. after first chunk has been received from the API).
Input Tokens Length: Length of tokens provided in the request. See Prompt Options above to see benchmarks of different input prompt lengths across other charts.
Median across providers: Figures represent median (P50) across all providers which support the model.
Output Speed Variance
+ Add model from specific provider
Output Tokens per Second; Results by percentile; Higher is better
Median, Other points represent 5th, 25th, 75th, 95th Percentiles respectively
Output Speed: Tokens per second received while the model is generating tokens (ie. after first chunk has been received from the API).
Boxplot: Shows variance of measurements
Output Speed, Over Time
+ Add model from specific provider
Output Tokens per Second; Higher is better
Output Speed: Tokens per second received while the model is generating tokens (ie. after first chunk has been received from the API).
Over time measurement: Median measurement per day, based on 8 measurements each day at different times. Labels represent start of week's measurements.
Median across providers: Figures represent median (P50) across all providers which support the model.
Seconds to First Tokens Chunk Received; Lower is better
Latency: Time to first token of tokens received, in seconds, after API request sent.
Median across providers: Figures represent median (P50) across all providers which support the model.
Latency by Input token (context) length
+ Add model from specific provider
Seconds to First Tokens Chunk Received; Lower is better
Short (100 tokens)
Medium (1,000 tokens)
Long (10,000 tokens)
Input Tokens Length: Length of tokens provided in the request. See Prompt Options above to see benchmarks of different input prompt lengths across other charts.
Latency: Time to first token of tokens received, in seconds, after API request sent.
Median across providers: Figures represent median (P50) across all providers which support the model.
Latency Variance
+ Add model from specific provider
Seconds to First Tokens Chunk Received; Results by percentile; Lower is better
Median, Other points represent 5th, 25th, 75th, 95th Percentiles respectively
Latency: Time to first token of tokens received, in seconds, after API request sent.
Boxplot: Shows variance of measurements
Latency, Over Time
+ Add model from specific provider
Seconds to First Tokens Chunk Received; Lower median is better
Latency: Time to first token of tokens received, in seconds, after API request sent.
Over time measurement: Median measurement per day, based on 8 measurements each day at different times. Labels represent start of week's measurements.
Median across providers: Figures represent median (P50) across all providers which support the model.
Total Response Time
Time to receive 100 tokens output, calculated by latency and output speed metrics
The speed difference between the fastest and slowest models is >3X. There is not always a correlation between parameter size and speed, or between price and speed.
Total Response Time: Time to receive a 100 token response. Estimated based on Latency (time to receive first chunk) and Output Speed (output tokens per second).
Median across providers: Figures represent median (P50) across all providers which support the model.
Total Response Time by Input token (context) length
+ Add model from specific provider
Seconds to Output 100 Tokens; Lower is better
Short (100 tokens)
Medium (1,000 tokens)
Long (10,000 tokens)
Input Tokens Length: Length of tokens provided in the request. See Prompt Options above to see benchmarks of different input prompt lengths across other charts.
Total Response Time: Time to receive a 100 token response. Estimated based on Latency (time to receive first chunk) and Output Speed (output tokens per second).
Median across providers: Figures represent median (P50) across all providers which support the model.
Total Response Time Variance
+ Add model from specific provider
Total: Response Time: Seconds to Output 100 Tokens; Results by percentile; Lower is better
Median, Other points represent 5th, 25th, 75th, 95th Percentiles respectively
Total Response Time: Time to receive a 100 token response. Estimated based on Latency (time to receive first chunk) and Output Speed (output tokens per second).
Boxplot: Shows variance of measurements
Total Response Time, Over Time
+ Add model from specific provider
Seconds to Output 100 Tokens; Lower is better
Total Response Time: Time to receive a 100 token response. Estimated based on Latency (time to receive first chunk) and Output Speed (output tokens per second).
Over time measurement: Median measurement per day, based on 8 measurements each day at different times. Labels represent start of week's measurements.
Median across providers: Figures represent median (P50) across all providers which support the model.
 GPT-4o and
  Llama 3.1 405B are the highest quality models, followed by
  Claude 3.5 Sonnet &
  Mistral NeMo (188 t/s) and
  Gemini 1.5 Flash (166 t/s) are the fastest models, followed by
  Sonar Small &
  Phi-3 Medium 14B (0.21s) and
  OpenChat 3.5 ($0.14) and
  Jamba Instruct.
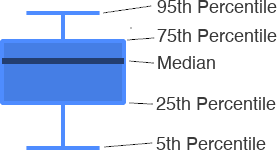


 Command Light


 DBRX Instruct
 Reka Core

 DeepSeek-Coder-V2
 Arctic Instruct
 Qwen2 Instruct 72B
 Yi-Large