
Sonar Large: API Provider Benchmarking & Analysis
Analysis of API providers for Sonar Large across performance metrics including latency (time to first token), output speed (output tokens per second), price and others. API providers benchmarked include Perplexity.
Comparison Summary
Output Speed (tokens/s):Sonar Large has a median output speed of 39 tokens per second on Perplexity.Latency (TTFT):Sonar Large has a latency of 0.25 seconds on Perplexity.Blended Price ($/M tokens):Sonar Large has a price of $1.00 per 1M tokens on Perplexity (blended 3:1) with an Input Token Price: $1.00 and an Output Token Price: $1.00.Input Token Price:Sonar Large has an input token price of $1.00 on Perplexity.Output Token Price:Sonar Large has an output token price of $1.00 on Perplexity.
Perplexity.Latency (TTFT):Sonar Large has a latency of 0.25 seconds on Perplexity.Blended Price ($/M tokens):Sonar Large has a price of $1.00 per 1M tokens on Perplexity (blended 3:1) with an Input Token Price: $1.00 and an Output Token Price: $1.00.Input Token Price:Sonar Large has an input token price of $1.00 on Perplexity.Output Token Price:Sonar Large has an output token price of $1.00 on Perplexity.Highlights
Quality
Artificial Analysis Quality Index; Higher is better
Speed
Output Tokens per Second; Higher is better
Price
USD per 1M Tokens; Lower is better
Parallel Queries:
Prompt Length:
Quality
Quality Evaluations (Preliminary Results)
Evaluation results measured independently by Artificial Analysis; Higher is better
Artificial Analysis Quality Index
Reasoning & Knowledge (MMLU)
Quantitative Reasoning (MATH)
Coding (HumanEval)
Artificial Analysis Quality Index: Represents the the average of each provider's results across evaluations.
Context Window
Context Window: Tokens Limit; Higher is better
Context window: Maximum number of combined input & output tokens. Output tokens commonly have a significantly lower limit (varied by model).
Variance between providers: While models have their own context window, in cases this is limited by providers.
Summary Analysis
Output Speed vs. Price
Output Speed: Output Tokens per Second; Price: Price: USD per 1M Tokens
Most attractive quadrant
Output Speed: Tokens per second received while the model is generating tokens (ie. after first chunk has been received from the API).
Price: Price per token, represented as USD per million Tokens. Price is a blend of Input & Output token prices (3:1 ratio).
Median: Figures represent median (P50) measurement over the past 14 days.
Latency vs. Output Speed
Latency: Seconds to First Tokens Chunk Received; Output Speed: Output Tokens per Second
Most attractive quadrant
Size represents Price (USD per M Tokens)
Output Speed: Tokens per second received while the model is generating tokens (ie. after first chunk has been received from the API).
Latency: Time to first token of tokens received, in seconds, after API request sent.
Price: Price per token, represented as USD per million Tokens. Price is a blend of Input & Output token prices (3:1 ratio).
Median: Figures represent median (P50) measurement over the past 14 days.
Pricing
Pricing: Input and Output Prices
USD per 1M Tokens; Lower is better
Input price
Output price
Input price: Price per token included in the request/message sent to the API, represented as USD per million Tokens.
Output price: Price per token generated by the model (received from the API), represented as USD per million Tokens.
Speed
Measured by Output Speed (tokens per second)
Output Speed
Output Tokens per Second; Higher is better
Output Speed: Tokens per second received while the model is generating tokens (ie. after first chunk has been received from the API).
Median: Figures represent median (P50) measurement over the past 14 days.
Output Speed Variance
Output Tokens per Second; Results by percentile; Higher is better
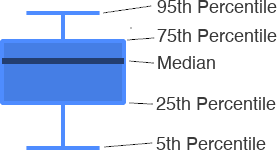
Median, Other points represent 5th, 25th, 75th, 95th Percentiles respectively
Output Speed: Tokens per second received while the model is generating tokens (ie. after first chunk has been received from the API).
Boxplot: Shows variance of measurements
Output Speed, Over Time
Output Tokens per Second; Higher is better
Output Speed: Tokens per second received while the model is generating tokens (ie. after first chunk has been received from the API).
Over time measurement: Median measurement per day, based on 8 measurements each day at different times. Labels represent start of week's measurements.
Output Speed by Input Token Count (Context Length)
Output Tokens per Second; Higher is better
100 input tokens
1k input tokens
10k input tokens
Input Tokens Length: Length of tokens provided in the request. See Prompt Options above to see benchmarks of different input prompt lengths across other charts.
Output Speed: Tokens per second received while the model is generating tokens (ie. after first chunk has been received from the API).
Median: Figures represent median (P50) measurement over the past 14 days.
Latency
Measured by Time (seconds) to First Token
Latency
Seconds to First Tokens Chunk Received; Lower is better
Latency: Time to first token of tokens received, in seconds, after API request sent.
Median: Figures represent median (P50) measurement over the past 14 days.
Latency Variance
Seconds to First Tokens Chunk Received; Results by percentile; Lower median is better
Median, Other points represent 5th, 25th, 75th, 95th Percentiles respectively
Latency: Time to first token of tokens received, in seconds, after API request sent.
Boxplot: Shows variance of measurements
Latency, Over Time
Seconds to First Tokens Chunk Received; Lower is better
Latency: Time to first token of tokens received, in seconds, after API request sent.
Over time measurement: Median measurement per day, based on 8 measurements each day at different times. Labels represent start of week's measurements.
Latency by Input Token Count (Context Length)
Seconds to First Tokens Chunk Received; Lower is better
100 input tokens
1k input tokens
10k input tokens
Input Tokens Length: Length of tokens provided in the request. See Prompt Options above to see benchmarks of different input prompt lengths across other charts.
Latency: Time to first token of tokens received, in seconds, after API request sent.
Median: Figures represent median (P50) measurement over the past 14 days.
Total Response Time
Time to receive 100 tokens output, calculated from latency and output speed metrics
Total Response Time vs. Price
Total: Response Time: Seconds to Output 100 Tokens; Price: Price: USD per 1M Tokens
Most attractive quadrant
Price: Price per token, represented as USD per million Tokens. Price is a blend of Input & Output token prices (3:1 ratio).
Total Response Time: Time to receive a 100 token response. Calculated based on Latency (time to receive first chunk) and Output Speed (output tokens per second).
Median: Figures represent median (P50) measurement over the past 14 days.
Total Response Time
Seconds to Output 100 Tokens; Lower is better
Total Response Time: Time to receive a 100 token response. Calculated based on Latency (time to receive first chunk) and Output Speed (output tokens per second).
Median: Figures represent median (P50) measurement over the past 14 days.
Total Response Time, Over Time
Seconds to Output 100 Tokens; Lower is better
Total Response Time: Time to receive a 100 token response. Calculated based on Latency (time to receive first chunk) and Output Speed (output tokens per second).
Over time measurement: Median measurement per day, based on 8 measurements each day at different times. Labels represent start of week's measurements.
Total Response Time by Input Token Count (Context Length)
Seconds to Output 100 Tokens; Lower is better
100 input tokens
1k input tokens
10k input tokens
Input Tokens Length: Length of tokens provided in the request. See Prompt Options above to see benchmarks of different input prompt lengths across other charts.
Total Response Time: Time to receive a 100 token response. Calculated based on Latency (time to receive first chunk) and Output Speed (output tokens per second).
Median: Figures represent median (P50) measurement over the past 14 days.
Summary Table of Key Comparison Metrics
Context | Model Quality | Price | Output tokens/s | Latency | ||
|---|---|---|---|---|---|---|
 | Sonar Large | 33k | $1.00 | 38.6 | 0.25 |