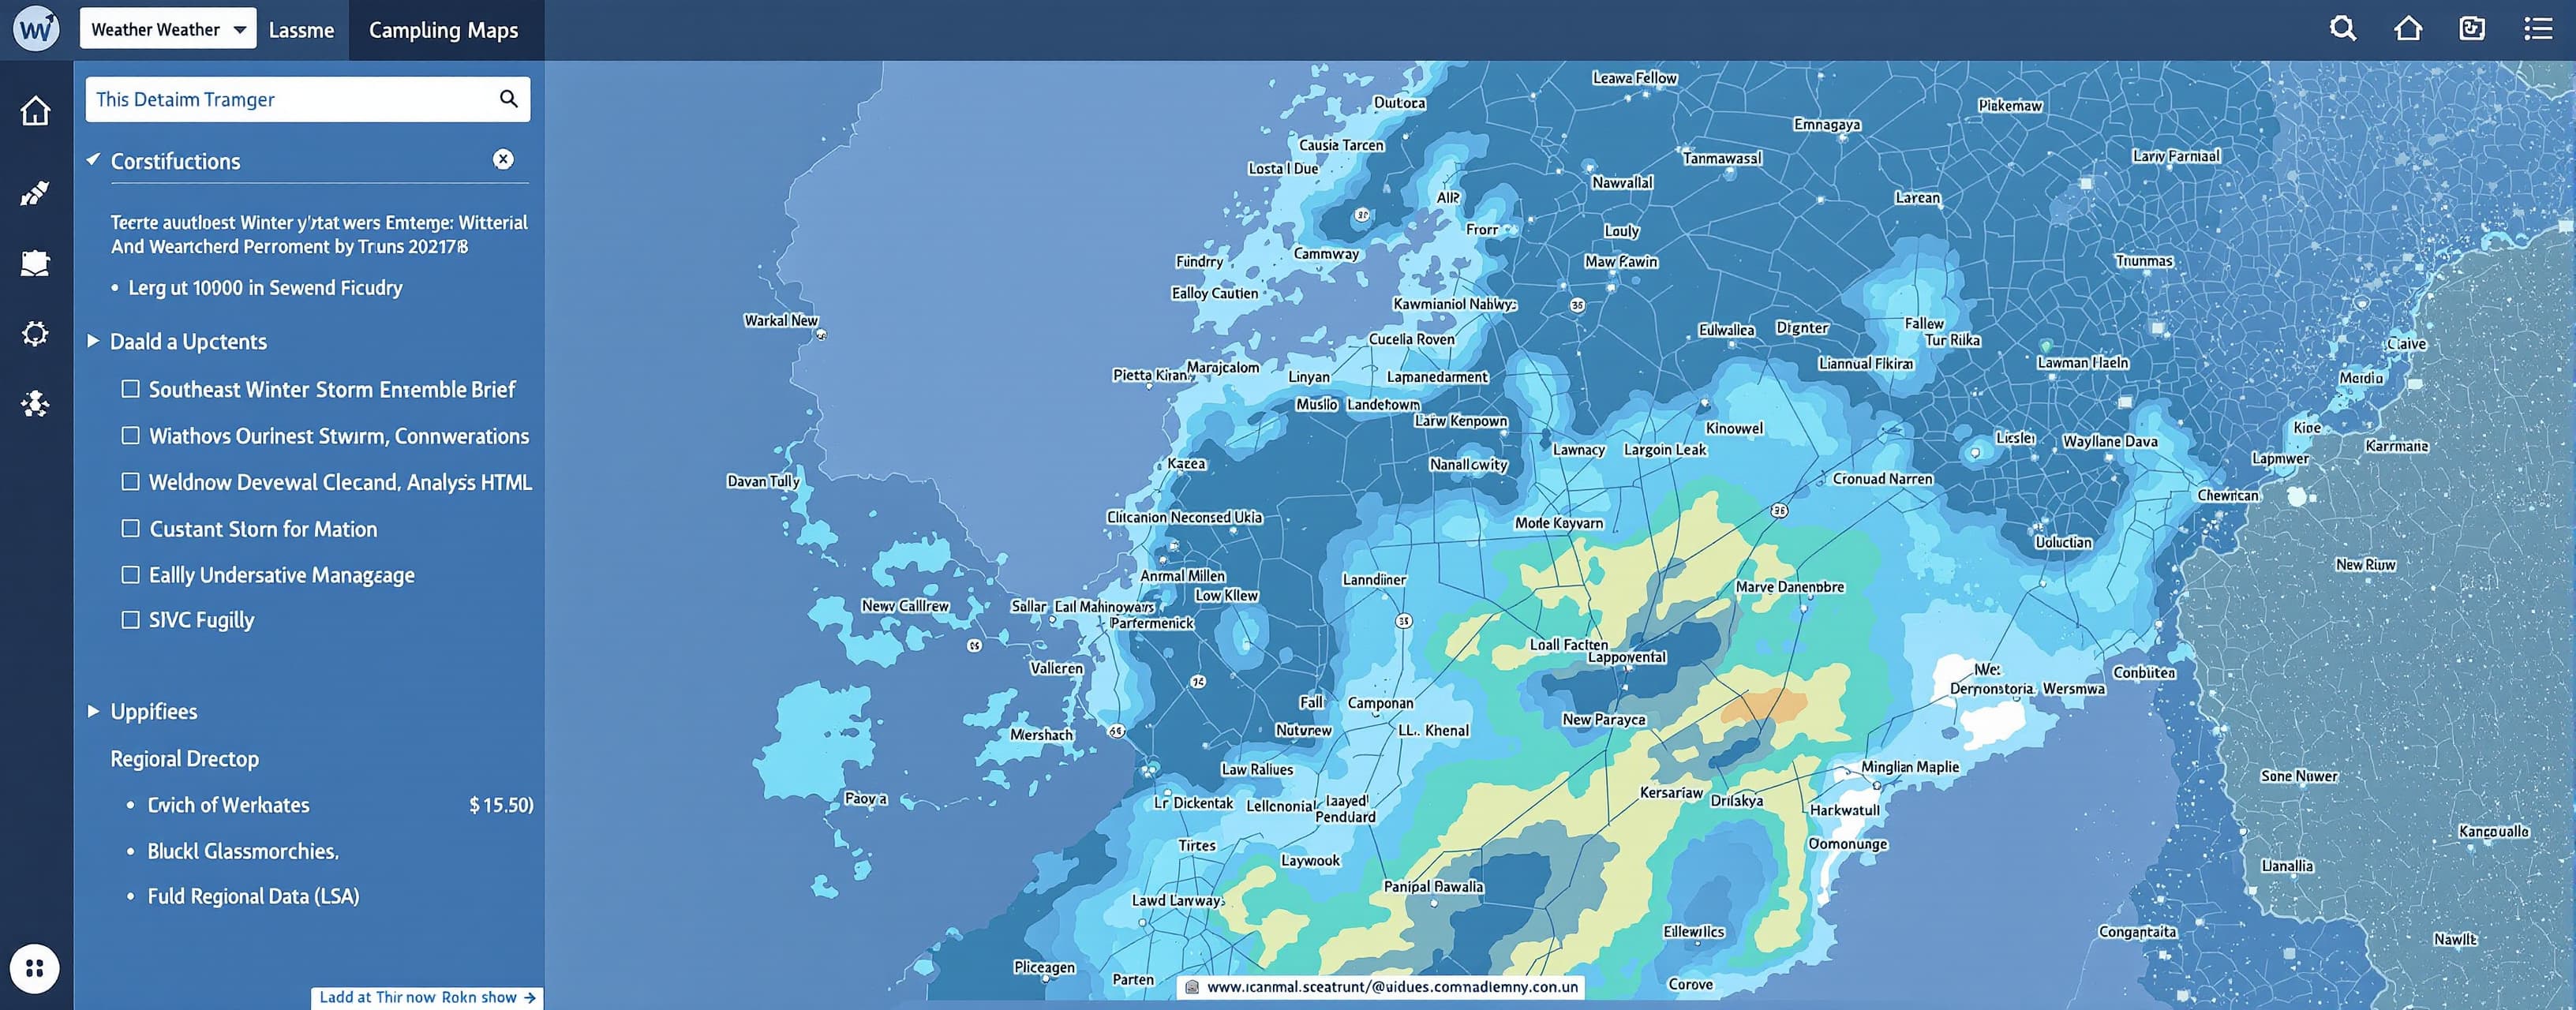
Southeast Winter Storm Ensemble Brief
uild one self-contained HTML document with inline CSS, SVG or Canvas, and JavaScript. It must run without external libraries, assets, fonts, APIs, or network access. Output only the finished HTML artifact.
Prompt
Create a polished, publication-ready interactive weather visualization titled **“Southeast Winter Storm Ensemble Brief.”** Build one self-contained HTML document with inline CSS, SVG or Canvas, and JavaScript. It must run without external libraries, assets, fonts, APIs, or network access. Output only the finished HTML artifact. All supplied data is fictional and exists solely for this benchmark. ## Visual direction Design this as a professional meteorological analysis product—not a generic dashboard. - Target a 1200 × 900 desktop composition that remains usable at 390px. - Make the regional map the dominant element. - Use compact typography, restrained borders, clear hierarchy, and generous map space. - Avoid glassmorphism, decorative weather emojis, excessive cards, and gratuitous animation. - Include title, forecast period, initialization time, legend, units, source note, and disclaimer. - Use a clean light map framed by a deep navy interface. Metadata: - **Issued:** 15 Jan 2027 · 18Z - **Valid:** 16 Jan 2027 6 PM – 17 Jan 2027 noon ET - **Dataset:** Synthetic 21-member ensemble ## Interactive controls Provide two accessible control groups: 1. **Scenario:** Baseline / Colder 2. **Layer:** Probability of ≥1 inch / Median snowfall Changing either control must update the map shading, legend, city badges, rankings, Raleigh details, and written takeaway without reloading. ## Regional map Draw a recognizable inline regional map covering Tennessee, Virginia, North Carolina, South Carolina, Georgia, Alabama, Kentucky, and West Virginia. Requirements: - Show credible coastlines and state boundaries. - Position cities geographically using their latitude and longitude. - Create smooth, spatially coherent contour-like fields from the city values using inverse-distance interpolation or another in-code interpolation method. - Do not merely color whole states or use a rectangular grid as the visible map. - Show compact city labels with the selected value. - Prevent label collisions; use leader lines where necessary. - Emphasize Raleigh without obscuring surrounding data. - Hovering or keyboard-focusing a city must reveal its full data for both scenarios. - Use visible geographic masking so shading does not spill far into the ocean. - Clearly communicate that interpolated areas are illustrative. Data columns are: `City | Latitude | Longitude | Baseline P≥1" | Baseline median inches | Colder P≥1" | Colder median inches` ```text Nashville, TN | 36.16 | -86.78 | 12 | 0.2 | 28 | 0.8 Knoxville, TN | 35.96 | -83.92 | 58 | 2.4 | 81 | 4.8 Asheville, NC | 35.60 | -82.55 | 76 | 4.1 | 93 | 7.2 Charlotte, NC | 35.23 | -80.84 | 47 | 1.5 | 72 | 3.6 Greensboro, NC | 36.07 | -79.79 | 65 | 2.8 | 84 | 5.1 Raleigh, NC | 35.78 | -78.64 | 54 | 1.9 | 78 | 4.2 Roanoke, VA | 37.27 | -79.94 | 83 | 5.6 | 95 | 8.4 Richmond, VA | 37.54 | -77.44 | 67 | 3.0 | 86 | 5.5 Fayetteville, NC | 35.05 | -78.88 | 29 | 0.6 | 51 | 1.8 Wilmington, NC | 34.21 | -77.89 | 8 | 0.0 | 22 | 0.4 Columbia, SC | 34.00 | -81.03 | 18 | 0.2 | 39 | 1.0 Greenville, SC | 34.85 | -82.40 | null | null | 62 | 2.5 Charleston, SC | 32.78 | -79.93 | 0 | 0.0 | 8 | 0.1 ``` `null` means unavailable. Display it as **N/A** with diagonal hatching and exclude it from rankings and interpolation. Numeric zero is valid data and must remain **0**, not N/A. ## Legends Probability of ≥1 inch: ```text 0–9% #E8EEF3 10–29% #B9DCEB 30–49% #79C7DC 50–69% #3DA6C8 70–89% #526FD2 90–100% #7D43B5 ``` Median snowfall: ```text 0 inches #E8EEF3 0.1–0.9 #C8EAF5 1.0–2.9 #7CCCE7 3.0–5.9 #438FD0 6.0–9.9 #6553B5 10.0+ #B03A91 ``` Use discrete swatches with exact labels. Do not present either scale as a continuous gradient. ## Analysis rail Beside the map, include: - Automatically calculated top-three and bottom-three city rankings for the selected layer and scenario. - Raleigh’s probability and median snowfall. - An ensemble spread graphic for Raleigh: - Baseline 10th/50th/90th percentiles: 0.4 / 1.9 / 5.3 inches - Colder 10th/50th/90th percentiles: 1.5 / 4.2 / 8.1 inches - A concise written takeaway that changes with the scenario. - For the colder scenario, specifically communicate that the I-85 corridor shifts from marginal to likely accumulation while the coastal plain remains lower confidence. Do not imply that median snowfall is the maximum plausible total or that probability and accumulation are interchangeable. ## Raleigh timeline Below the map, create a compact SVG meteogram for Raleigh. Show: - Temperature as a solid line. - A clearly labeled 32°F freezing line. - Snowfall rate as vertical bars. - A categorical precipitation-type strip. - Separate axes and units. - Tooltips and keyboard-accessible data points. Baseline: ```text Time: 6 PM 9 PM 12 AM 3 AM 6 AM 9 AM 12 PM Temperature °F: 35 33 32 31 31 33 36 Snow rate in/h: 0 0 0.2 0.6 0.4 0.1 0 Precip type: rain mix snow snow snow mix rain ``` Colder: ```text Time: 6 PM 9 PM 12 AM 3 AM 6 AM 9 AM 12 PM Temperature °F: 33 31 29 28 28 30 33 Snow rate in/h: 0 0.1 0.5 0.9 0.7 0.3 0 Precip type: mix snow snow snow snow snow mix ``` Annotate the peak snowfall rate at 3 AM in each scenario. ## Quality requirements - Preserve every supplied value exactly. - Synchronize every view when controls change. - Keep all city labels, controls, legends, and tooltips unclipped. - Ensure keyboard focus is visible and color is never the only means of communication. - Respect reduced-motion preferences. - On mobile, reorganize the layout without removing the map, legend, timeline, or uncertainty information. - Include this footer: **Synthetic benchmark data—not a real forecast. Consult official forecasts and warnings for weather decisions.**
A system prompt was added to support web rendering
 OpenAI
Response not available
OpenAI Anthropic
Response not available
OpenAI