ROLE You are building a hackathon prototype for a Dam Break ...
Prompt
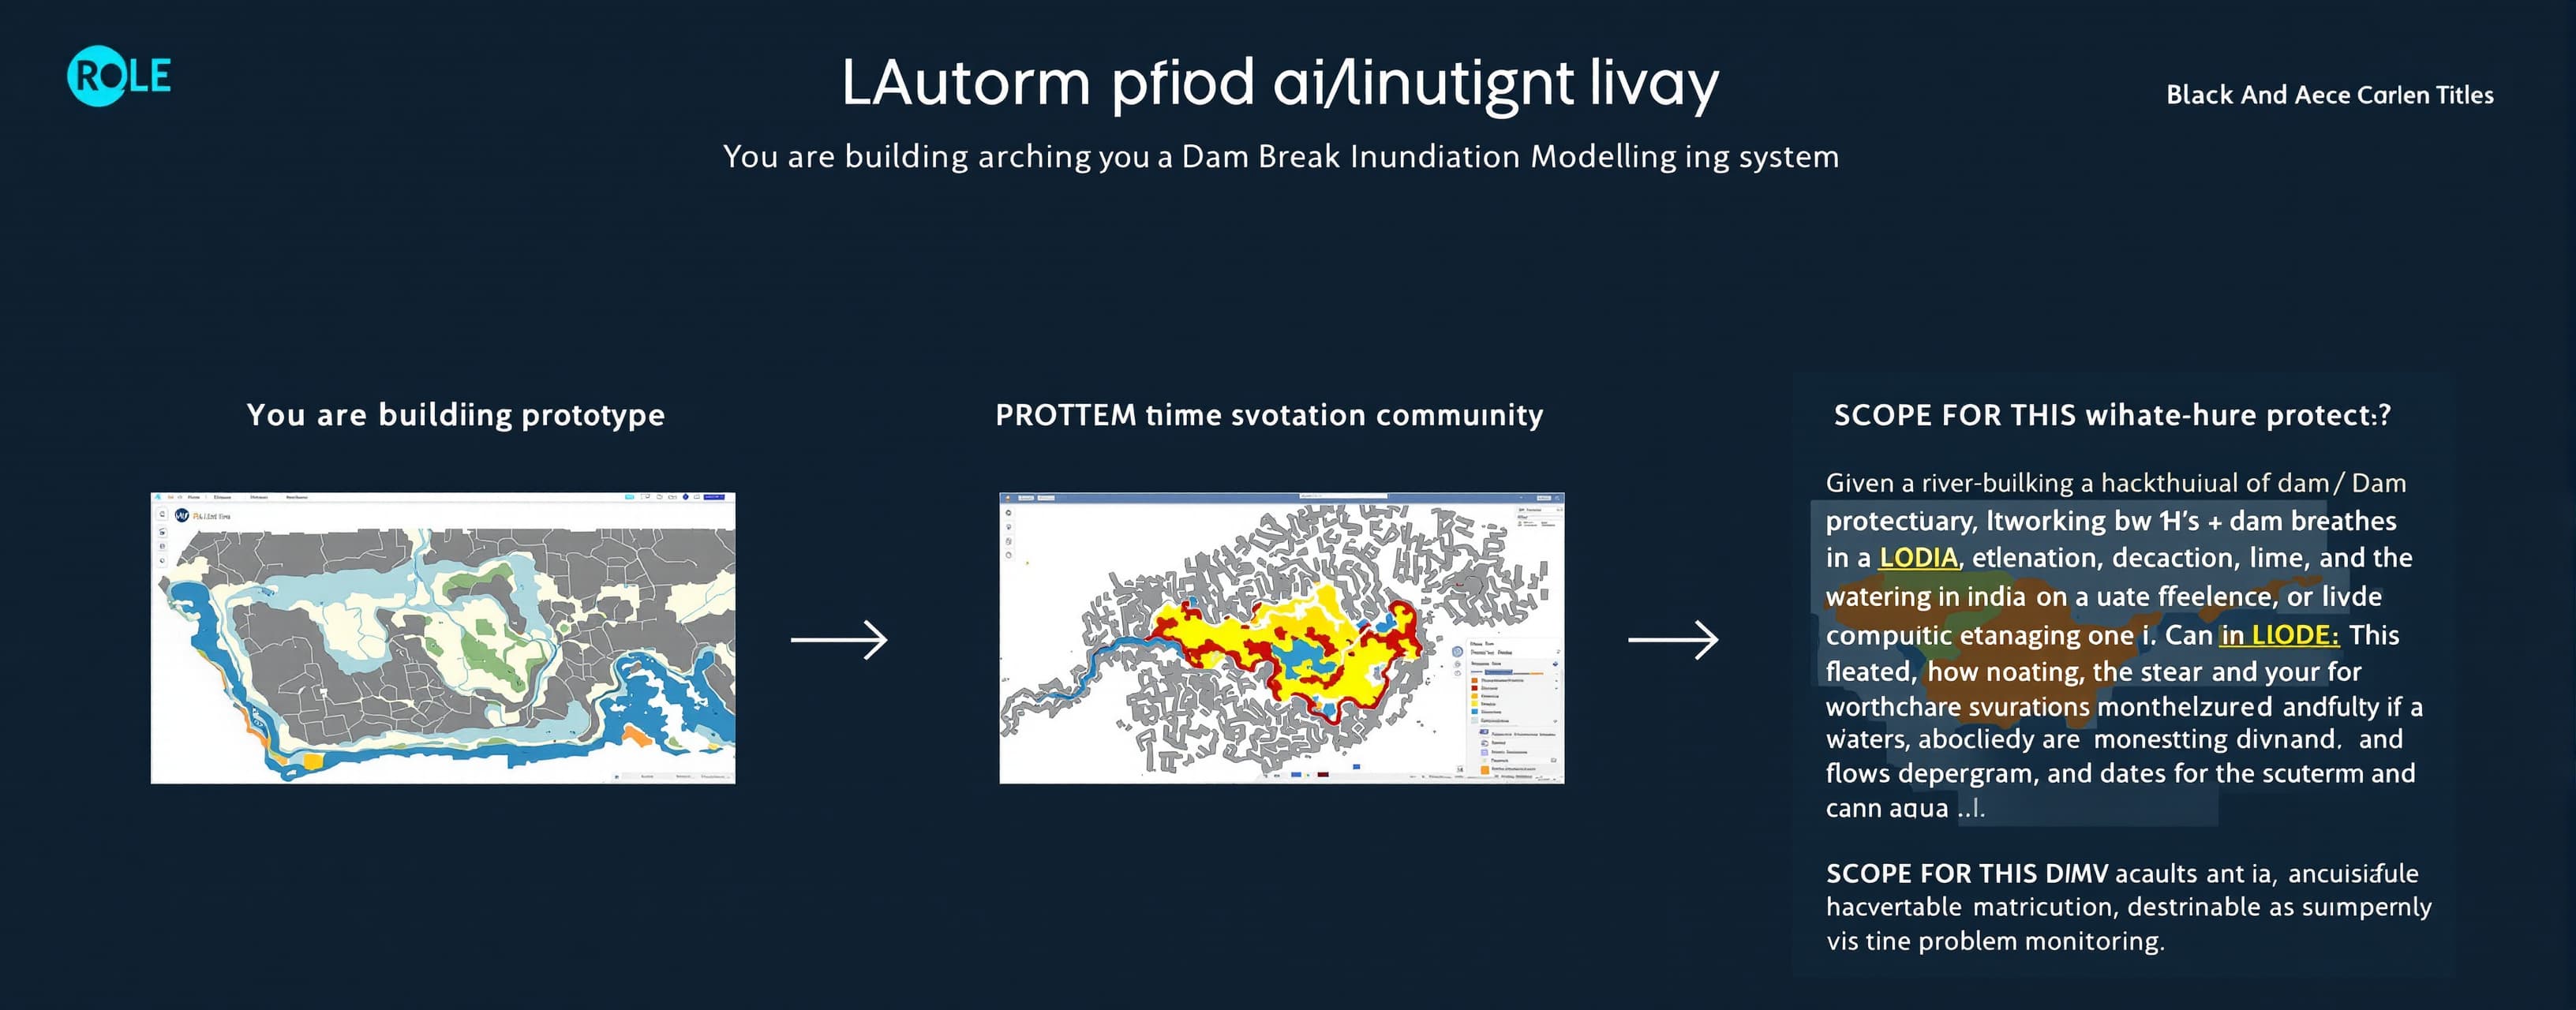
ROLE You are building a hackathon prototype for a Dam Break Inundation Modelling system. Goal: a working, demo-able end-to-end pipeline in 24-48 hours, not a production system. Prioritize a fully working simplified pipeline over a partially working complex one. PROBLEM CONTEXT Given a river + dam location in India, simulate what happens if the dam breaches: how much water is released, how it flows downstream, and what area gets flooded. Output must be visual (map) and GIS-standard (.shp/.geojson/.kml), with a basic dashboard for input and output, plus a mocked "near-real-time monitoring" feature. SCOPE FOR THIS PROTOTYPE (deliberately simplified vs. the full problem statement) - ONE demo river/dam only, hardcoded as default but swappable via a config file (recommend: a small/medium Indian dam with public CWC/India-WRIS data, or a synthetic test DEM if data access is blocked). - Use OPEN DATA ONLY: SRTM 30m DEM (via elevation/opentopography API or a pre-downloaded tile), OpenStreetMap for river/settlement layers. - Replace Delft3D/SPH with a LIGHTWEIGHT OPEN-SOURCE SHALLOW WATER / DIFFUSIVE WAVE MODEL you can run in Python (e.g. a simple 2D raster flood-fill / cellular automaton flood spread model, or pyswmm/landlab/simple finite-difference shallow water solver). Frame this in the UI as "Fast Screening Model" - be explicit in the demo narrative that this stands in for SPH/Delft3D at prototype stage, and the architecture is designed to swap in the full models later. - Breach hydrograph: implement a simplified physically-based breach model (Froehlich equations) taking dam height, reservoir volume, and breach parameters as input, producing an outflow hydrograph (Q vs time). - Flood routing: route the breach hydrograph downstream over the DEM using the screening model above, producing time-stepped inundation depth rasters. - Output: convert final inundation extent to GeoJSON (simplest) and .shp download. - Dashboard: single-page web app (React or Streamlit - pick Streamlit if time is tight) with: 1. Input panel: pick/enter dam height, reservoir volume, breach parameters (or load from config), see dam location on map 2. "Run Simulation" button that runs the breach model + flood routing 3. Map output: inundation extent + depth overlaid on a basemap (Leaflet/ Folium/Mapbox), with a time slider if feasible 4. Exposure summary panel: rough affected area (km²) and estimated population using a static population density value or WorldPop sample 5. Download buttons for .geojson/.shp/.kml - "Near-real-time monitoring" feature (mocked for demo): a panel that shows a simulated/sample Sentinel-1 water-extent time series for the reservoir (can be synthetic/sample data) with a threshold line, and an "ALERT" state that triggers when a slider/simulated value crosses it, auto-populating the simulation inputs and running it. This demonstrates the concept without requiring a live GEE account/auth to work during the demo. OUT OF SCOPE FOR THIS PROTOTYPE (state clearly to judges as "next phase") - Actual DualSPHysics / Delft3D integration - Live Google Earth Engine authentication/streaming - Multi-river generalization beyond the config file - ML-based breach parameter prediction (mention as planned enhancement) - Full validation against historical satellite flood extent TECH STACK (prefer these for speed) - Backend/model: Python (numpy, rasterio, geopandas, shapely, richdem or whitebox for DEM conditioning) - Frontend: Streamlit (fastest) OR React + Leaflet if more polish is wanted and time allows - Map rendering: Folium/Leaflet with GeoJSON layers - Data: rasterio/GDAL for DEM handling, requests for any open API calls - Packaging: single repo, README with setup + run instructions, requirements.txt DELIVERABLES 1. A working local app (`streamlit run app.py` or `npm start` + `python backend.py`) that runs the full pipeline end-to-end on the demo river 2. Sample DEM/data bundled in the repo (do not rely on internet access during the actual demo - cache/download data ahead of time) 3. A README explaining: what's real vs. simulated/mocked, how this maps to the full problem statement (SPH+Delft3D, GEE, dashboard, .shp/.kml output), and how to swap in a different river via config 4. Clean, presentable UI - this is a hackathon, visual polish and a working live demo matter as much as backend correctness BUILD ORDER (do not skip steps out of order - each step must work before next) 1. Load/condition a DEM for the demo area, confirm it renders on a map 2. Implement breach hydrograph generator, test with sample dam parameters, plot Q vs time 3. Implement flood routing over the DEM using the hydrograph, confirm you get a sane inundation raster (not empty, not covering whole map) 4. Convert output raster to vector (.geojson/.shp), confirm it overlays correctly on the map 5. Wrap steps 1-4 in the dashboard with the input panel and run button 6. Add exposure summary (area + rough population estimate) 7. Add the mocked near-real-time monitoring panel last, since it's cosmetic for the demo 8. Polish: loading states, error handling for bad inputs, README At each step, run it and confirm output looks reasonable before moving to the next step. Flag clearly if any step's output looks physically implausible (e.g. flood covering the entire DEM, or zero flooded area) rather than proceeding silently.
 Z AI
Z AI OpenAIOpenAI
 Google