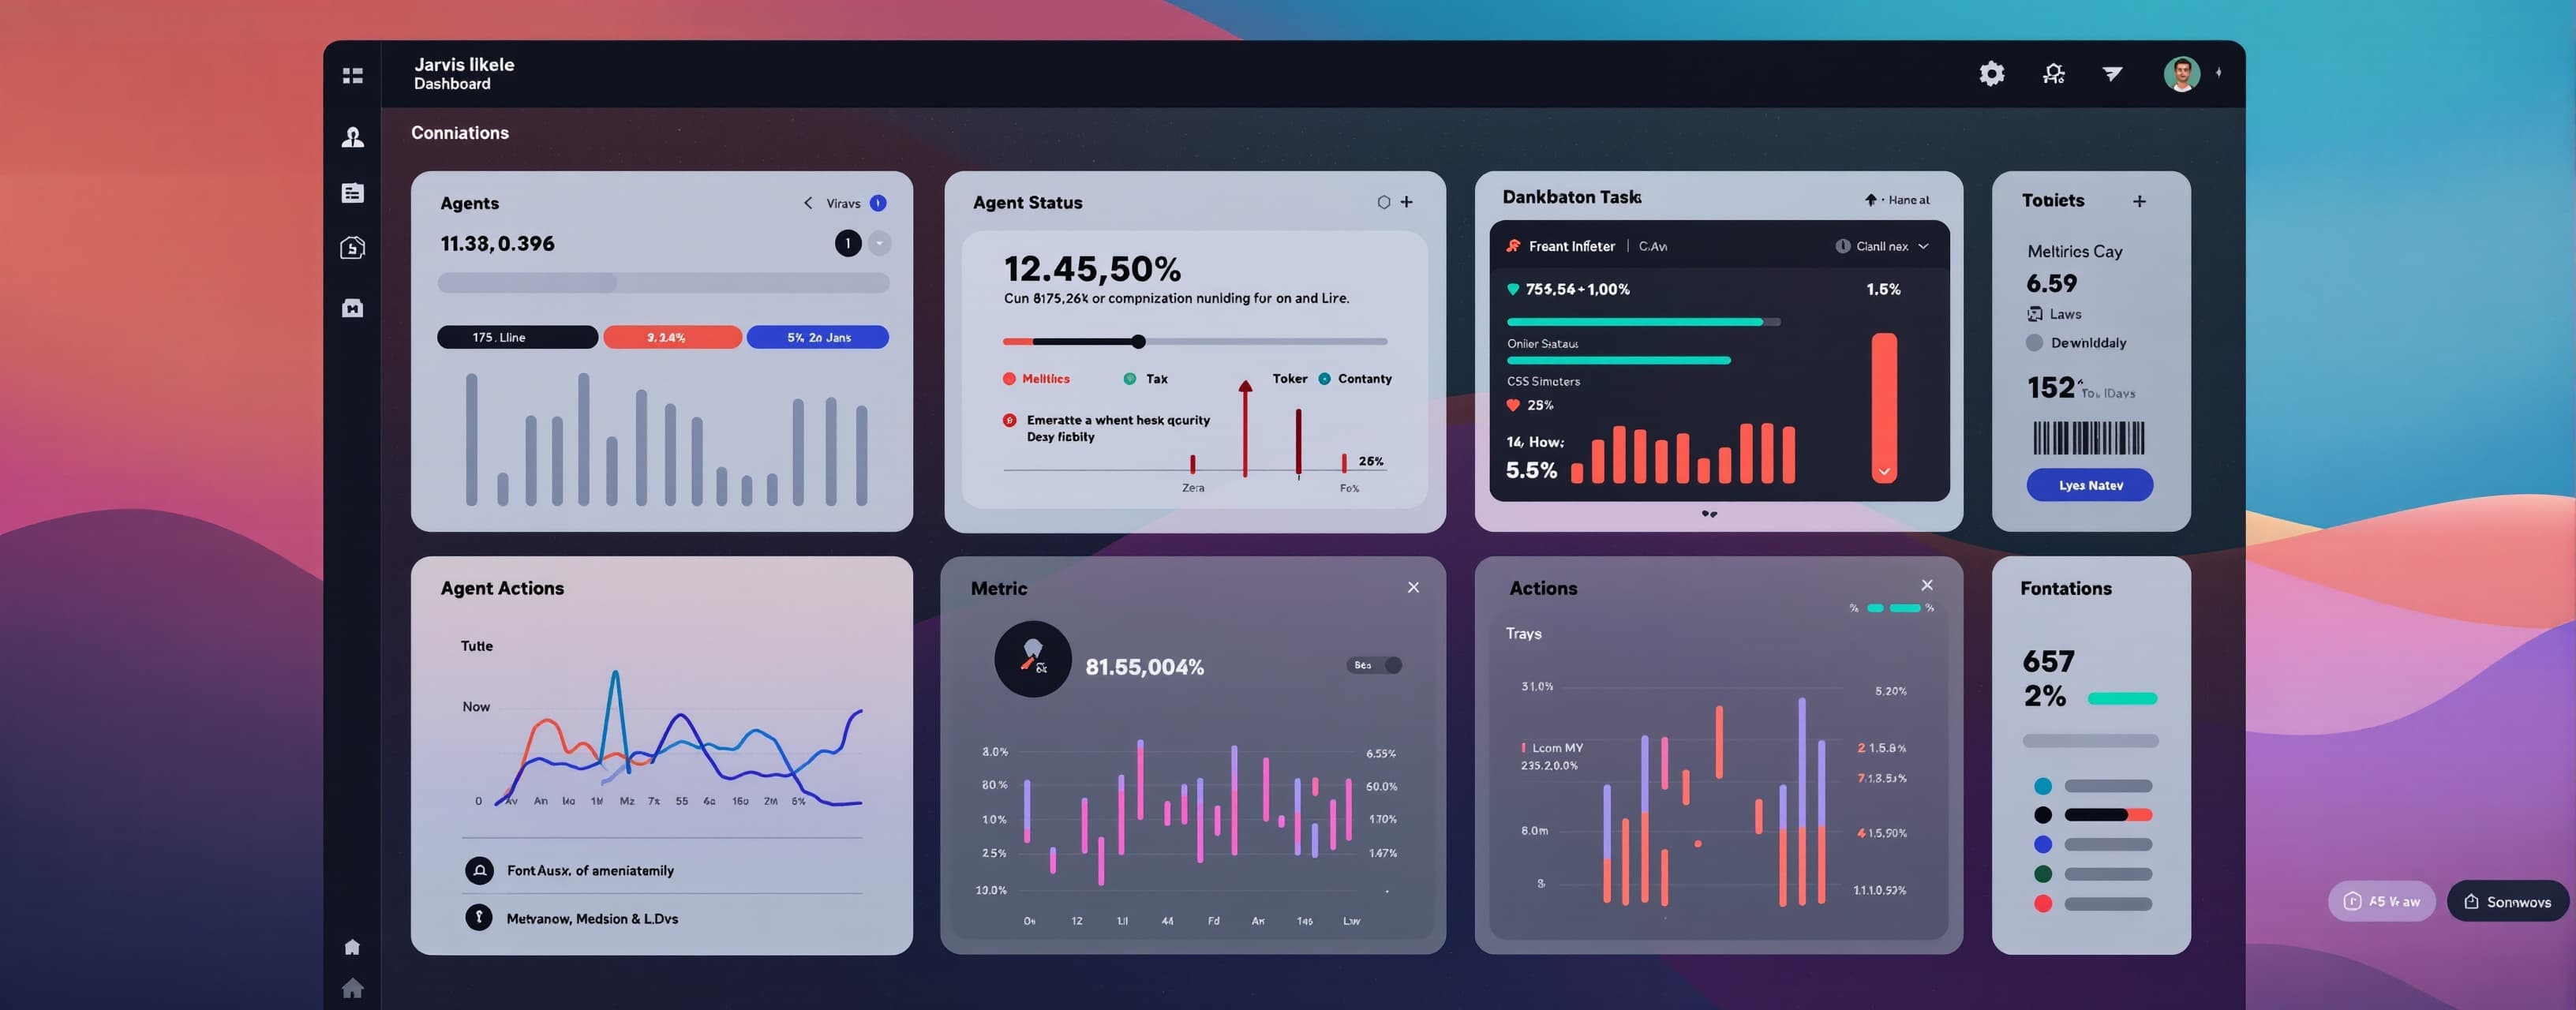
Jarvis-like dashboard
Multitask one-shot coding
Prompt
Create a single, self-contained, high-fidelity HTML file for an "Agentic Personal Productivity Dashboard" inspired by minimalist, Jarvis-like HUDs. This file must run standalone on any standard browser without needing a compilation step, an NPM environment, or a local backend web server. ### 1. Core Architecture & Tech Stack - **File Structure:** A single index.html file containing all CSS (via CDNs) and vanilla JavaScript. - **Styling:** Tailwind CSS CDN (<script src="https://cdn.tailwindcss.com"></script>) with a dark, cyber-minimalist palette (slate/zinc dark backgrounds, neon accents like emerald for online status, amber for metrics, and cyan for agent actions). - **Icons:** Lucide Icons or FontAwesome via CDN. - **Charts/Data Vis:** Chart.js via CDN for metrics tracking. - **Interactive Skill Map:** Vis.js or d3.js via CDN to render an interactive, node-based graph network mimicking Obsidian's graph view. ### 2. Dashboard Sections & UI Layout The dashboard layout should use a responsive CSS Grid/Flexbox architecture optimized for a 16:9 desktop viewport, featuring: - **Header / Status HUD:** - **Sleek Time & Date:** Large, highly stylized digital clock (HH:MM:SS) updating every second, alongside a clean date format (e.g., Friday, July 3, 2026). - **Internet Diagnostics:** A "Network Health" widget that simulates connection state. It calculates a mock latency ping in milliseconds (ms) and keeps an escalating timer tracking "Total Time Connected". (Note: Since raw ICMP is impossible in the browser, implement an asynchronous JavaScript routine using an HTTP HEAD request/fetch to a public endpoint or fake the latency variance beautifully between 12ms and 45ms to look alive). - **Hermes Agent Tracker (Simulation Area):** - **Live Progress/Updates:** A scrolling terminal-style UI log streaming simulated live updates of an agent performing technical operations (e.g., "Parsing main.py", "Generating vector embeddings for skill...", "Optimizing local context loop"). - **Token & Cost Ledger:** Display panels showcasing "Total Tokens Used", divided by input/output tokens. It must compute real-time cost accumulation based on the model prices configured in the settings. - **Data Visualizations:** - **Performance Graphs:** A line chart displaying an execution metric over time (e.g., Model FLOPs Utilization %, Tokens per second, or task success vectors). - **Obsidian-Style Skill Map:** An interactive, draggable, and zoomable 2D network graph. Populated by rich, simulated nested folder structures (e.g., `root/math/calculus.md`, `root/coding/python_kernel.py`, `root/agent/SKILL.md`). Clicking a node displays a sleek slide-out panel showing mock contents of the markdown or script file. - **Settings Menu:** - Form fields allowing the user to view and adjust pricing parameters (Cost per 1M Input Tokens, Cost per 1M Output Tokens) for multiple pre-configured models. Changing these inputs dynamically forces JavaScript to recalculate all mock token costs on the main page view. - A mock "Daily Morning Briefing" generator module containing a placeholder text zone displaying a concise productivity brief of yesterday's completed agent tasks. ### 3. Execution Requirements - All data must be driven by highly realistic mock JSON structures declared inside the global `<script>` tags. - Ensure smooth transitions, a cohesive dark-mode aesthetic, and high scannability.
A system prompt was added to support web rendering
 Anthropic
 Xiaomi
 Alibaba
 DeepSeek