API 제공업체 비교
모델을 선택하여 지연 시간, 생성 시간, 가격별로 제공업체 비교
API 생성 시간
API 가격
API 생성 시간 vs. API 가격
최근 이미지 생성
선택한 각 제공업체가 동일한 이미지 프롬프트와 시드로 생성한 결과
Flat vector illustration titled "The Curbside Problem". Three sorting bins with arrows to their destinations sits at the center, carrying two keyed regions, "Paper" shaded blue and "Glass" shaded green. Three stat chips run down a bottom row, reading "10 sorting lines running", "68% diverted from landfill" and "1 truck every 24 minutes". Each key color matches the shading of the region it names.
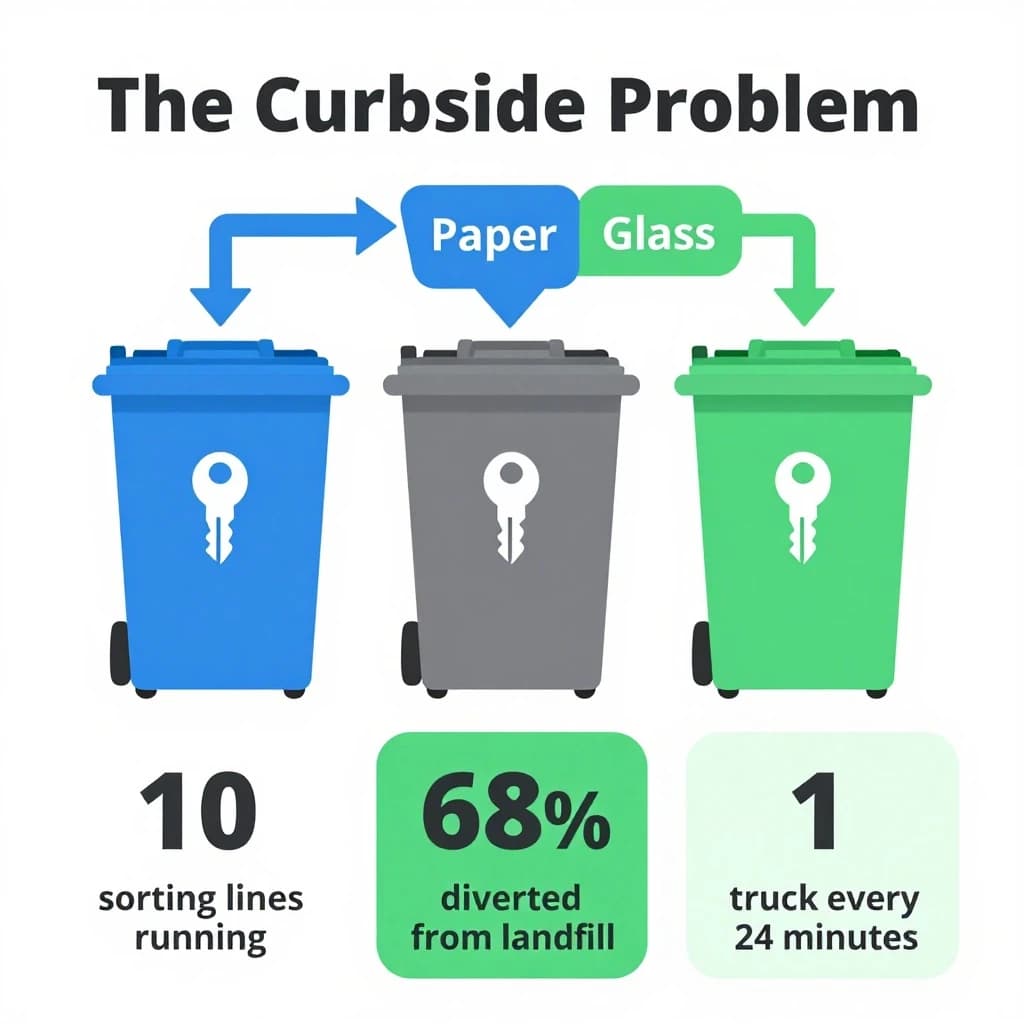
 Z-Image Turbo, Replicate수정1.3초
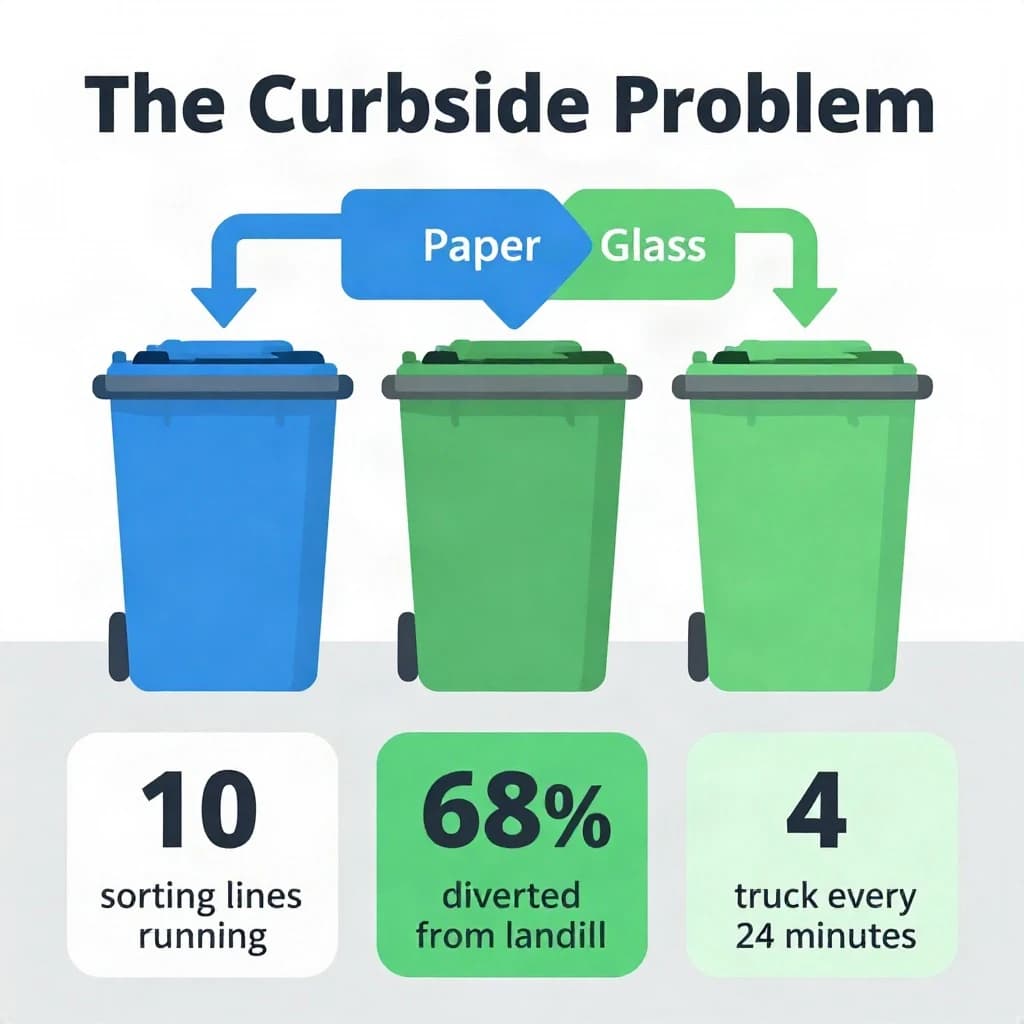
 Z-Image Turbo, fal.ai2.1초
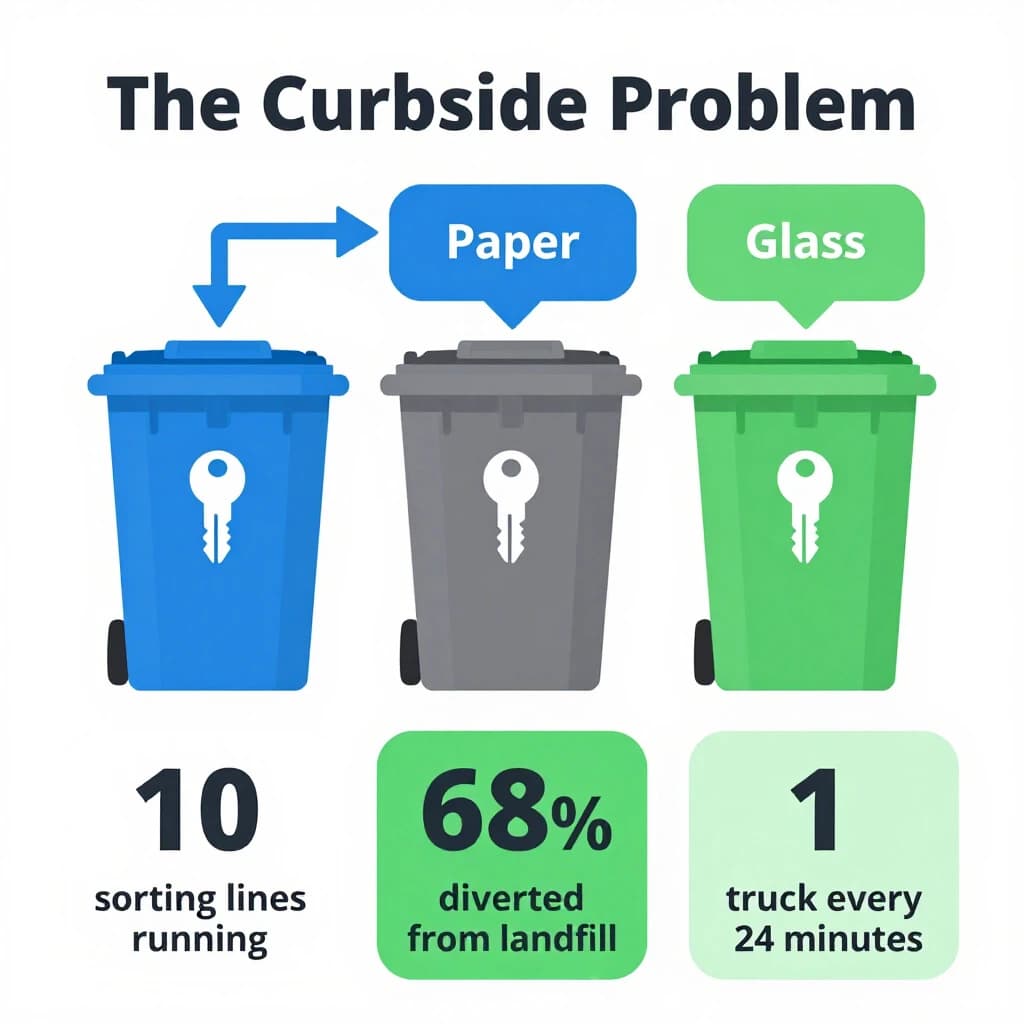
 Z-Image Turbo, Runware3.4초
Cinematic photograph for a streetwear campaign, shot straight down a narrow rain-slick alleyway at dusk. Four models spread through the depth of the frame: the nearest crouches on a milk crate in a red puffer, two stand mid-alley in matching black coats, one leaning on a roll-up shutter and one holding a lollipop, and the farthest stands under the single working lamp in white. Three of the six fire escapes above carry laundry lines; the rest are bare. A delivery bike lies on its side between the two middle models. Blurred street traffic only at the far end.
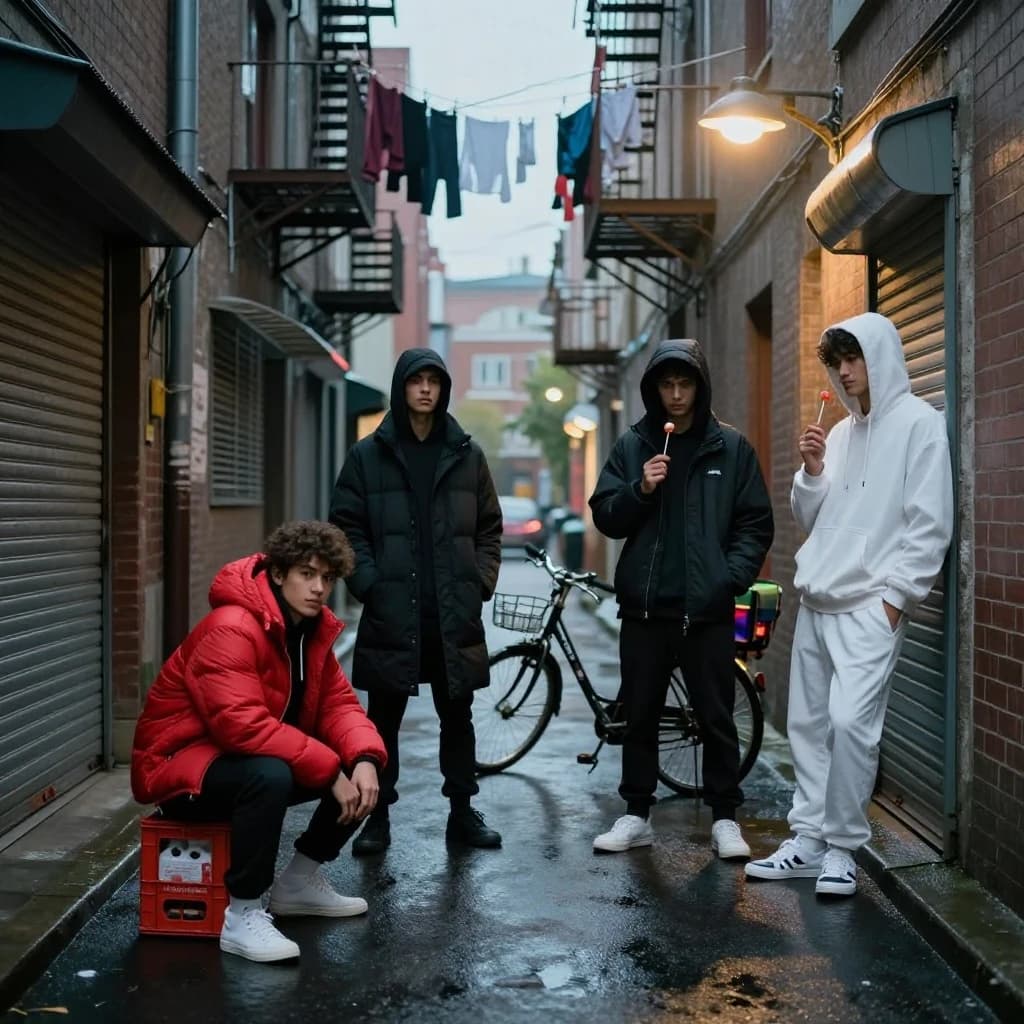 Z-Image Turbo, Replicate수정1.3초
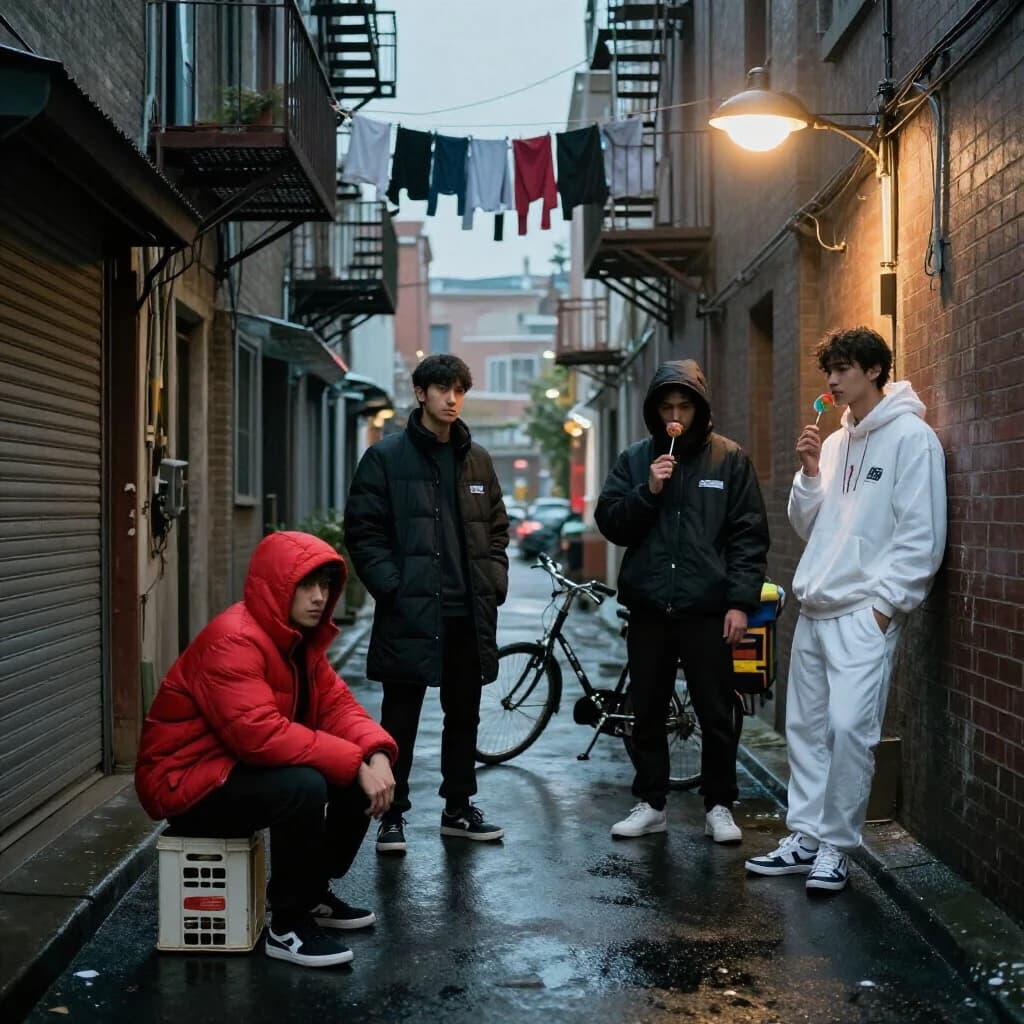 Z-Image Turbo, Runware3.2초
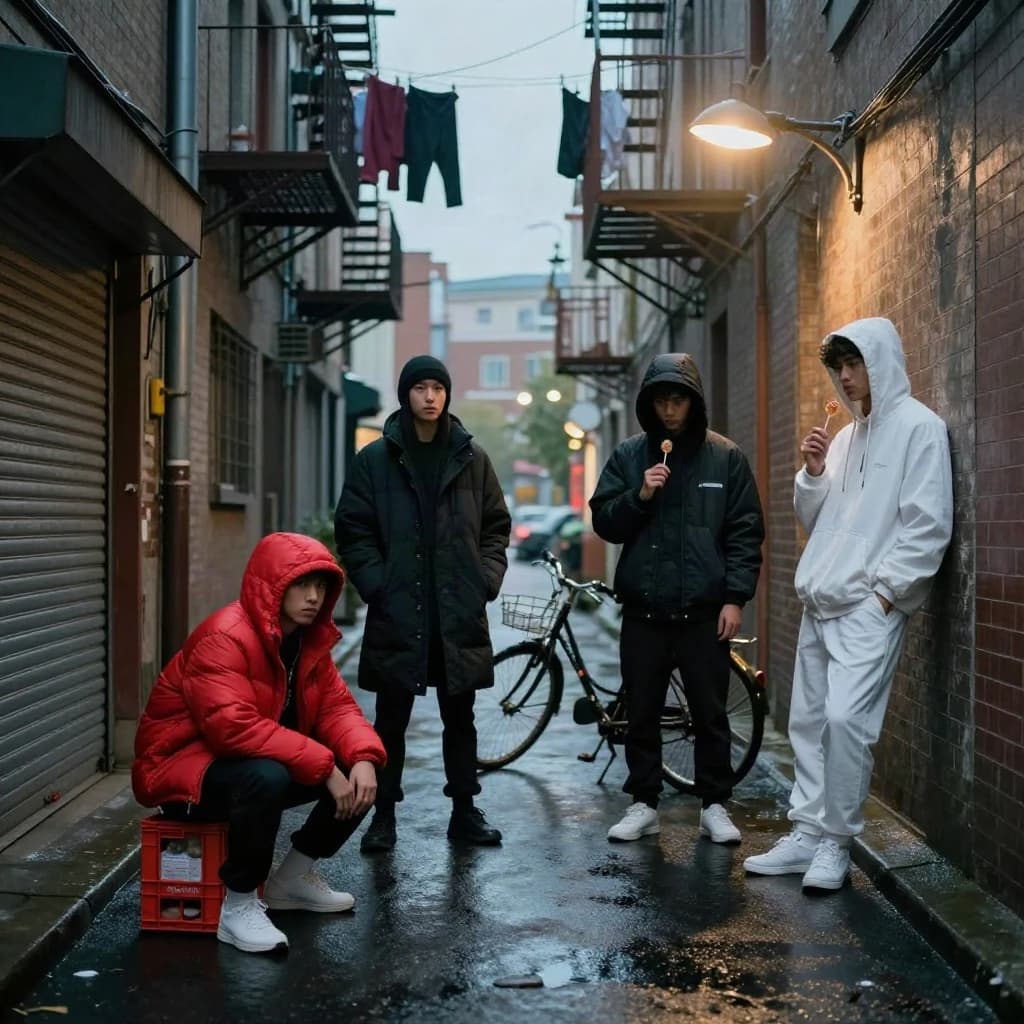 Z-Image Turbo, fal.ai5.9초
Linocut print: one bookstore owl mascot in three views. The views are captioned "front", "side" and "back" in that order. The wordmark "Hollow Crest" appears on every view with a small anchor mark beside it. The red-and-cream coloring is the same across every view, and only the angle changes.
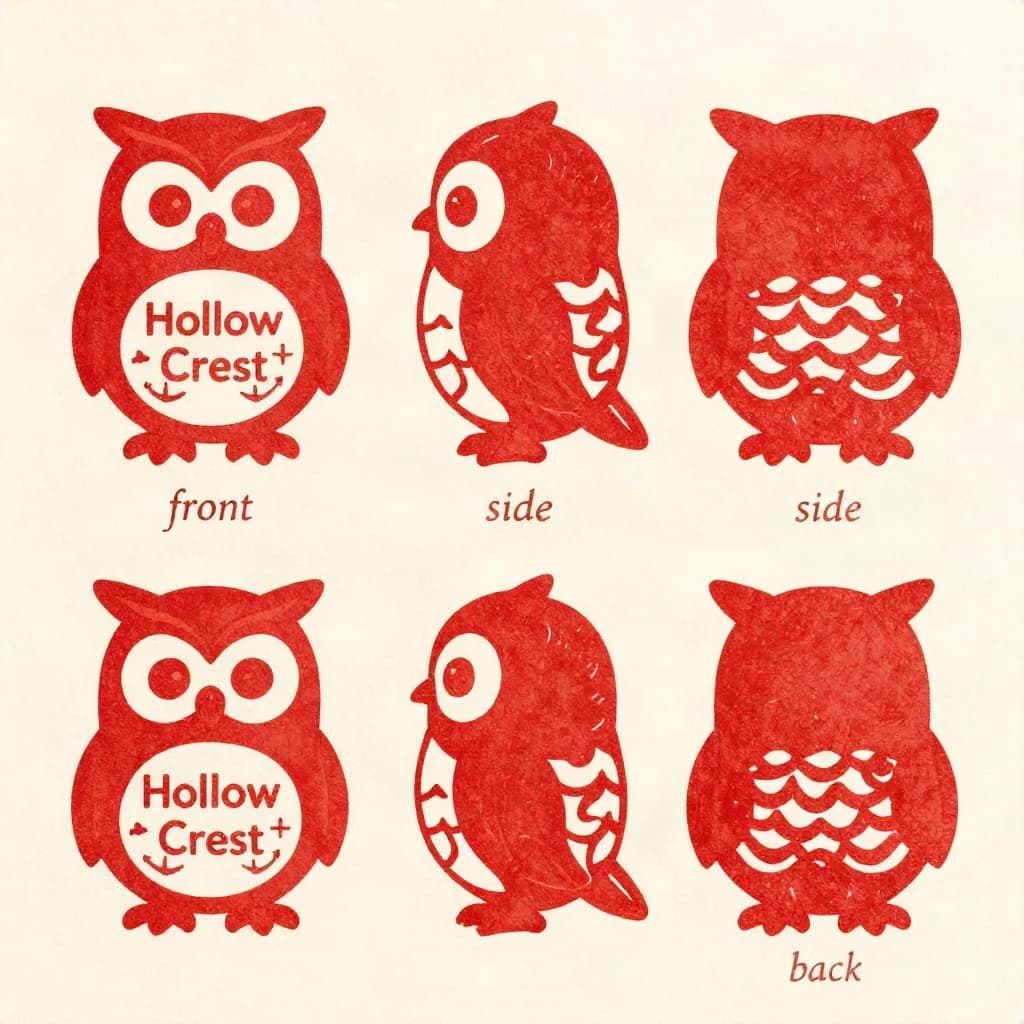 Z-Image Turbo, fal.ai1.7초
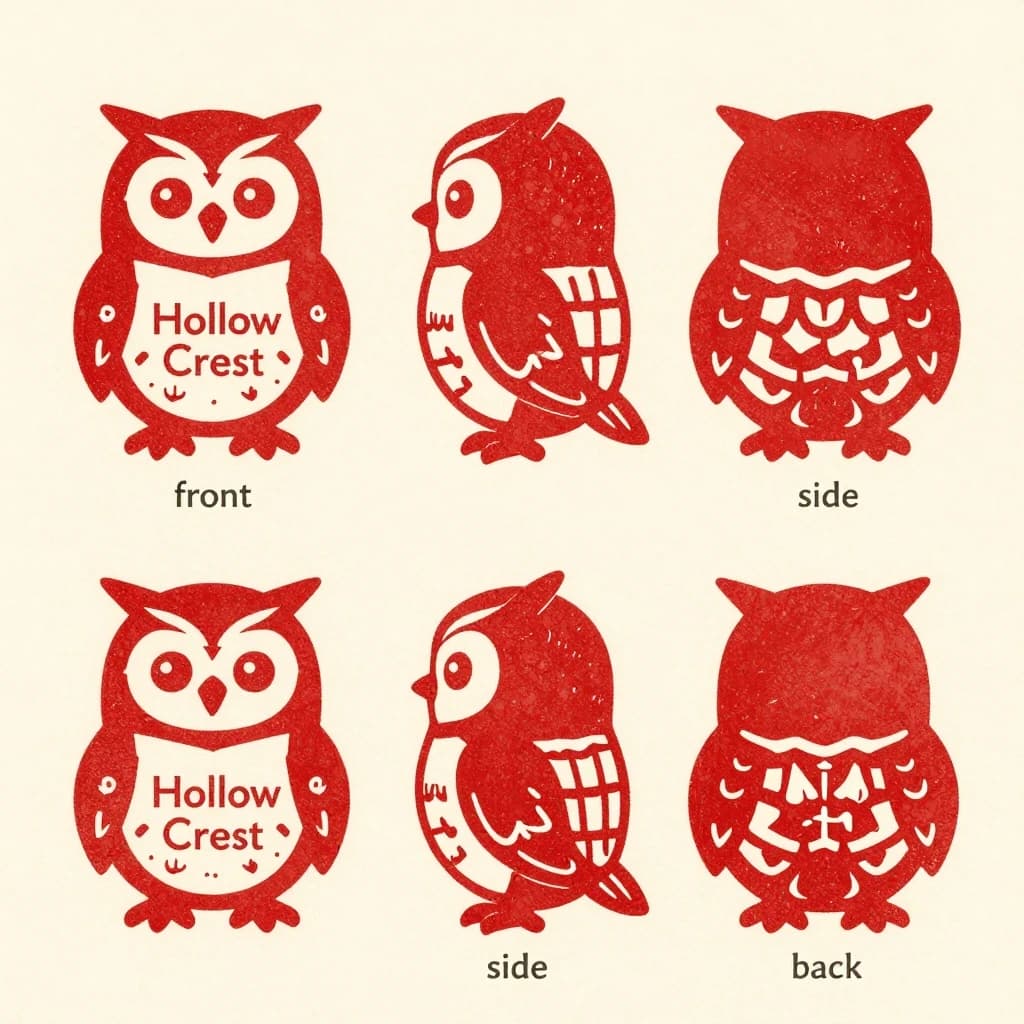 Z-Image Turbo, Replicate수정3.0초
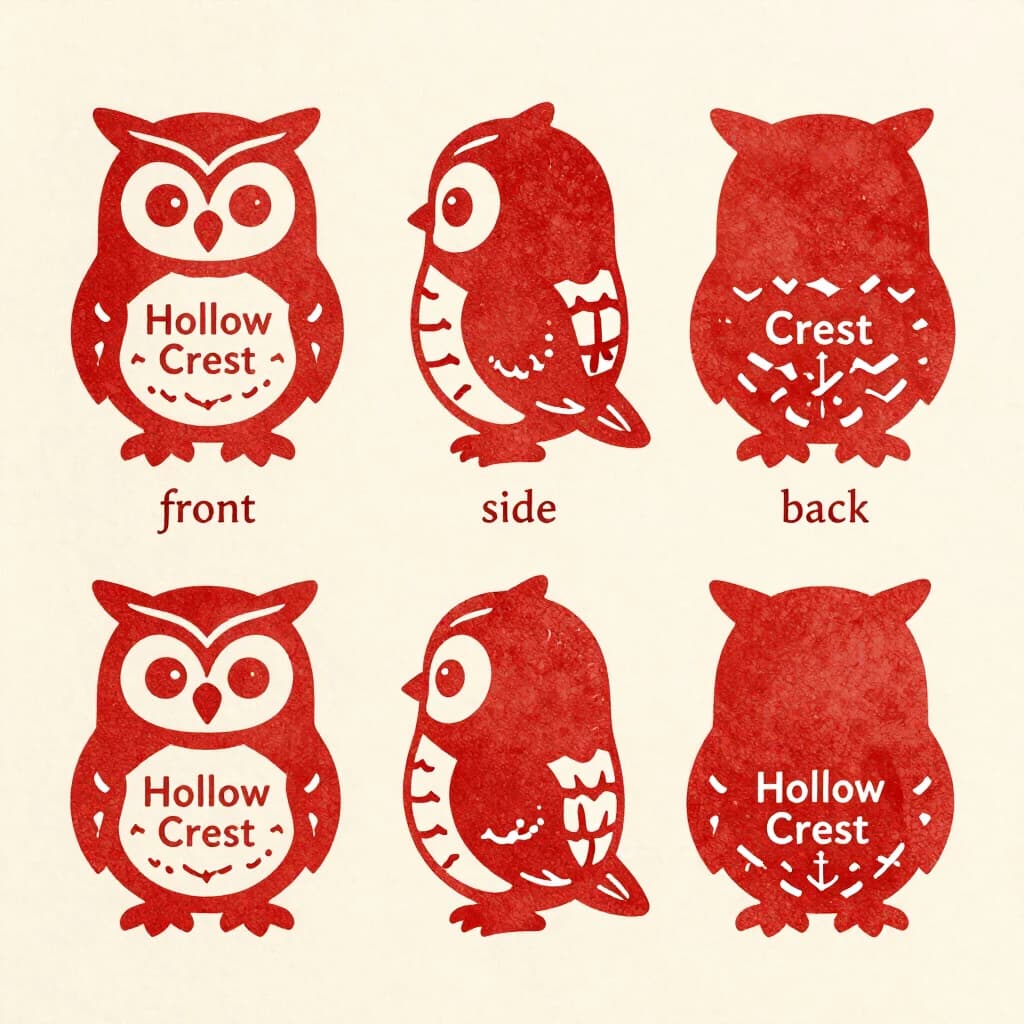 Z-Image Turbo, Runware3.1초
Interior render of a glasshouse butterfly conservatory, white cast iron arches and misted glass, humid morning light. A raised planting bed spirals through the centre with a gravel path running around it. Five feeding stations on slim posts stand along the path, each holding a shallow dish of orange slices: monarch butterflies cluster on three of the dishes while two are untouched. Seven more monarchs rest on the milkweed in the bed and two are in flight above the path. Three visitors in the room, a child crouching at the nearest feeding station, an adult behind her pointing upward, and a guide standing at the far end beside an information board. Fine mist drifting near the roof vents. Physically based render.
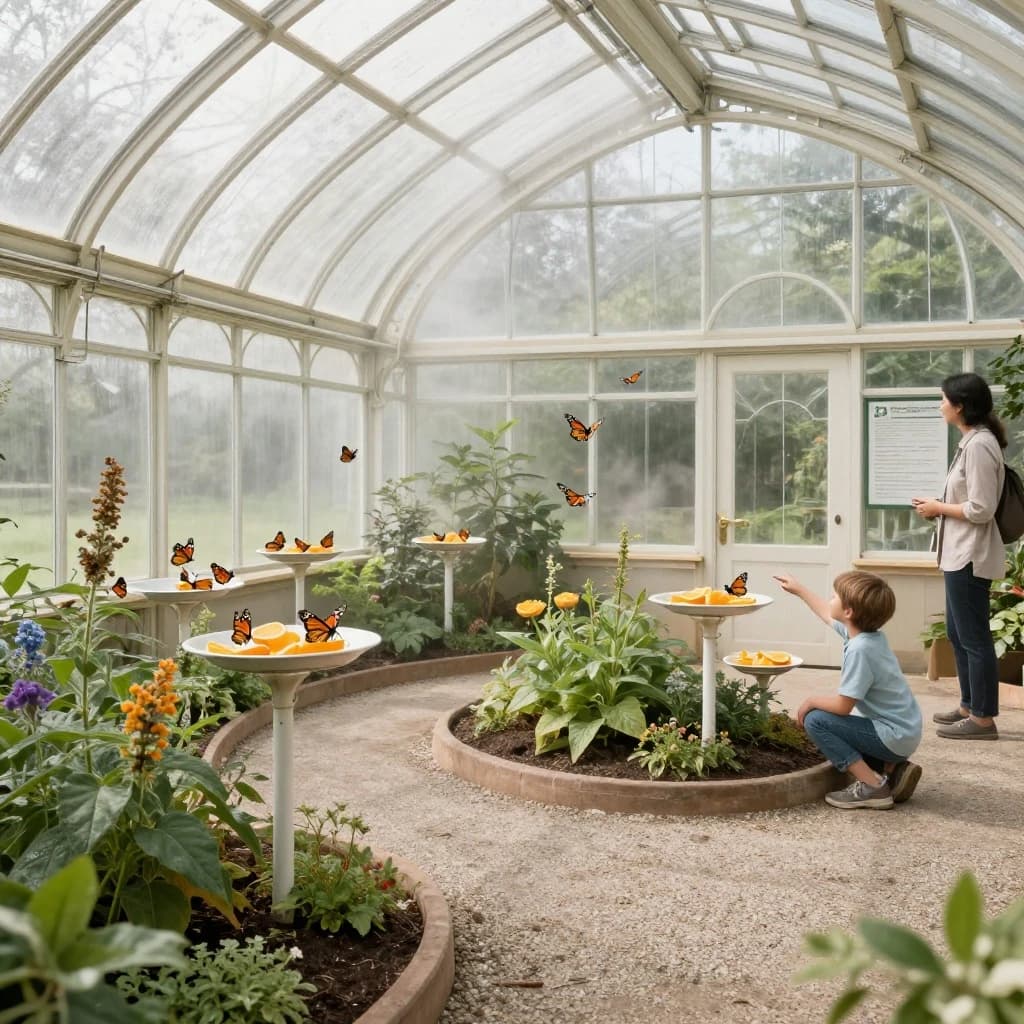 Z-Image Turbo, Replicate수정1.6초
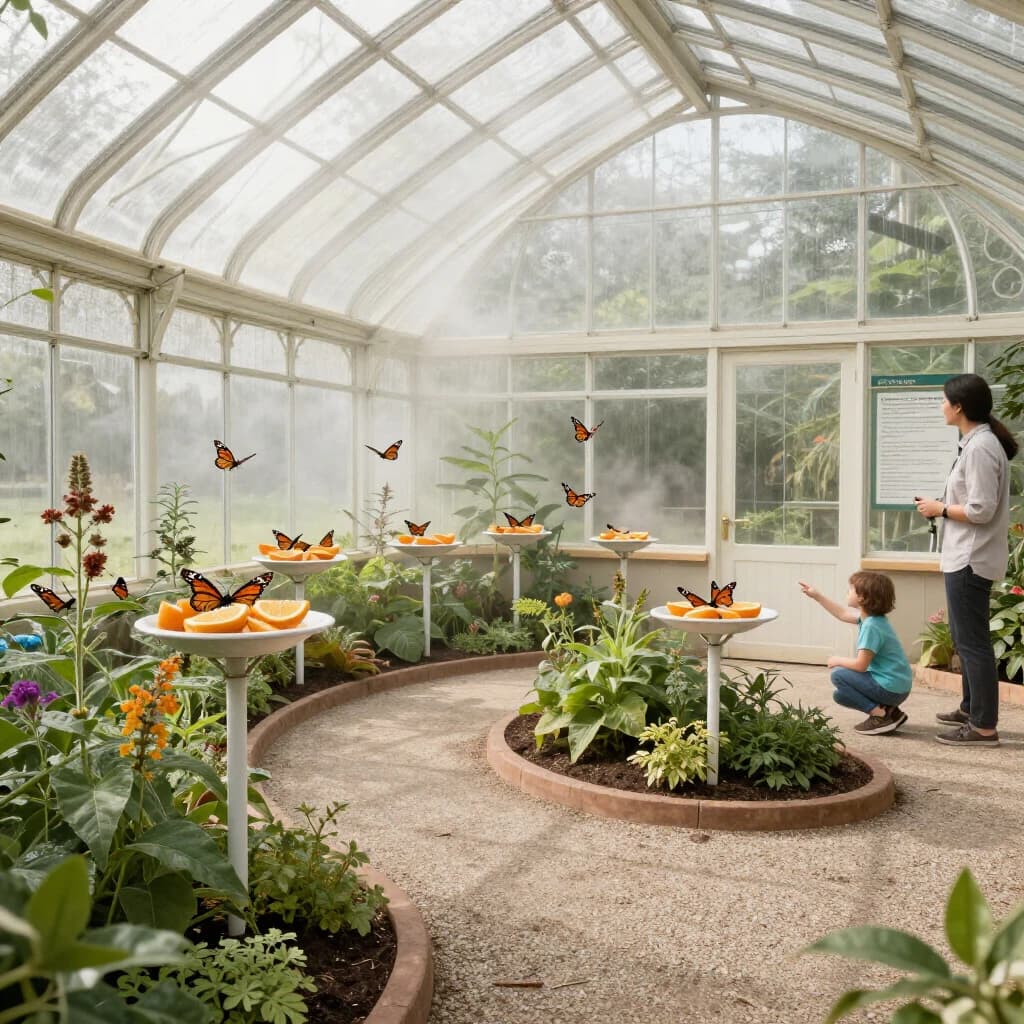 Z-Image Turbo, Runware3.4초
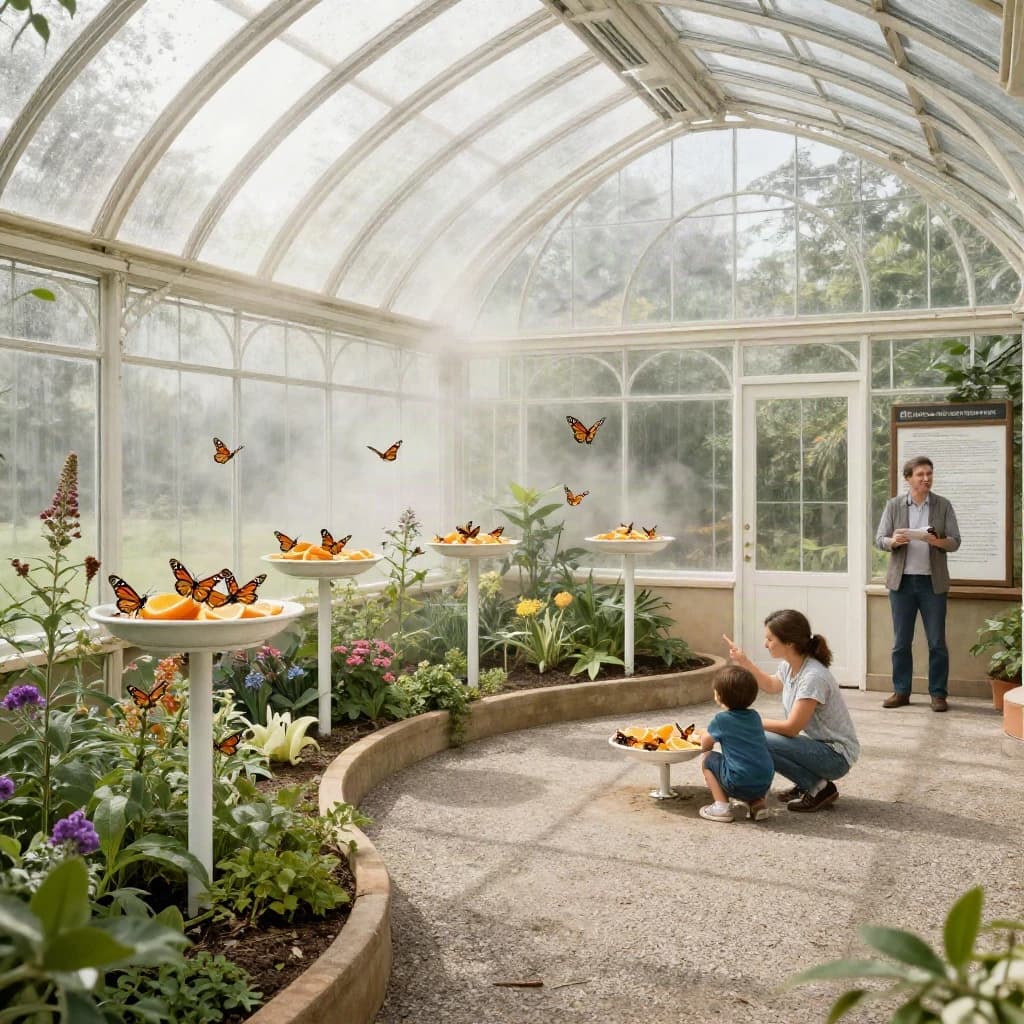 Z-Image Turbo, fal.ai5.9초
Flat infographic titled "Rainfall by the Numbers": at the center a twelve-month rainfall timeline, carrying two keyed regions, "Average" shaded pale green and "Wettest" shaded dark blue, beside a bottom row of three stat chips reading "1 dry spell every 4 weeks", "175 rain days last year" and "380mm in the wettest month".
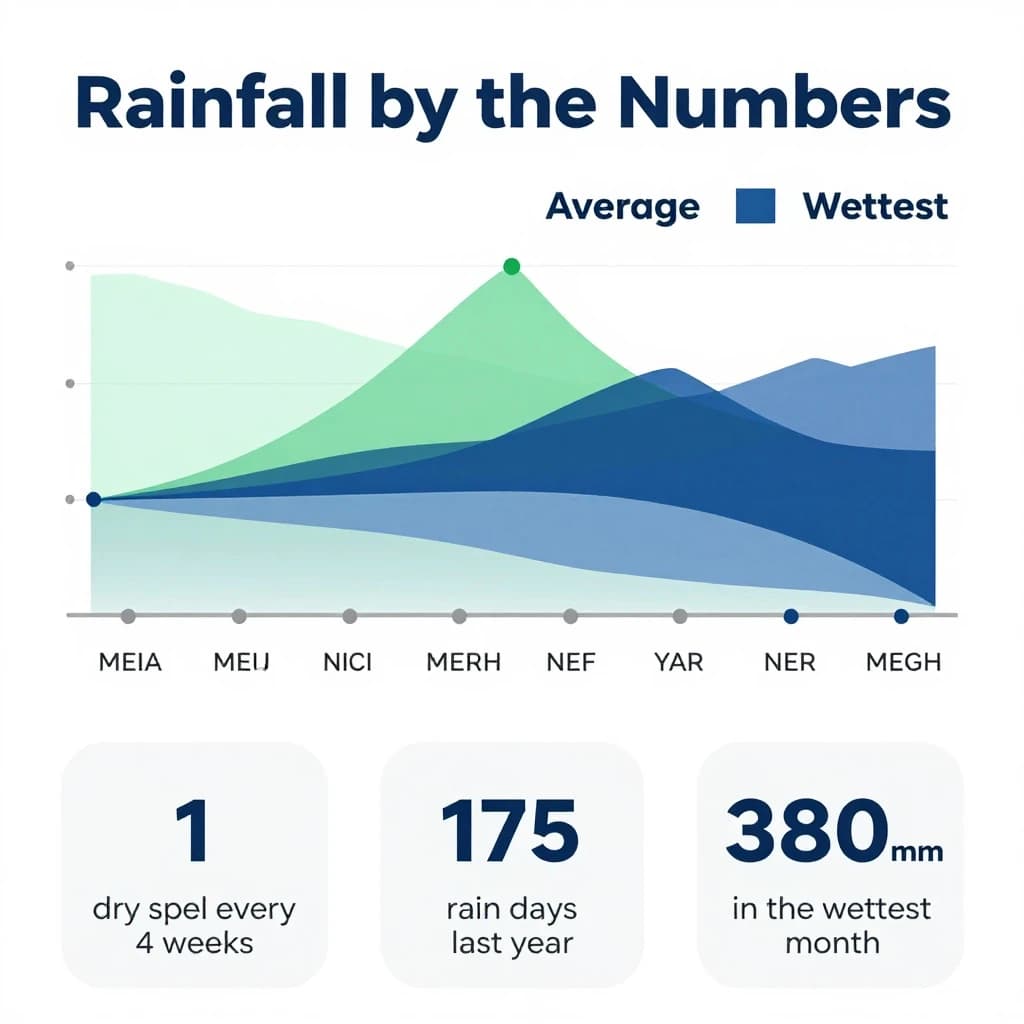 Z-Image Turbo, Replicate수정1.2초
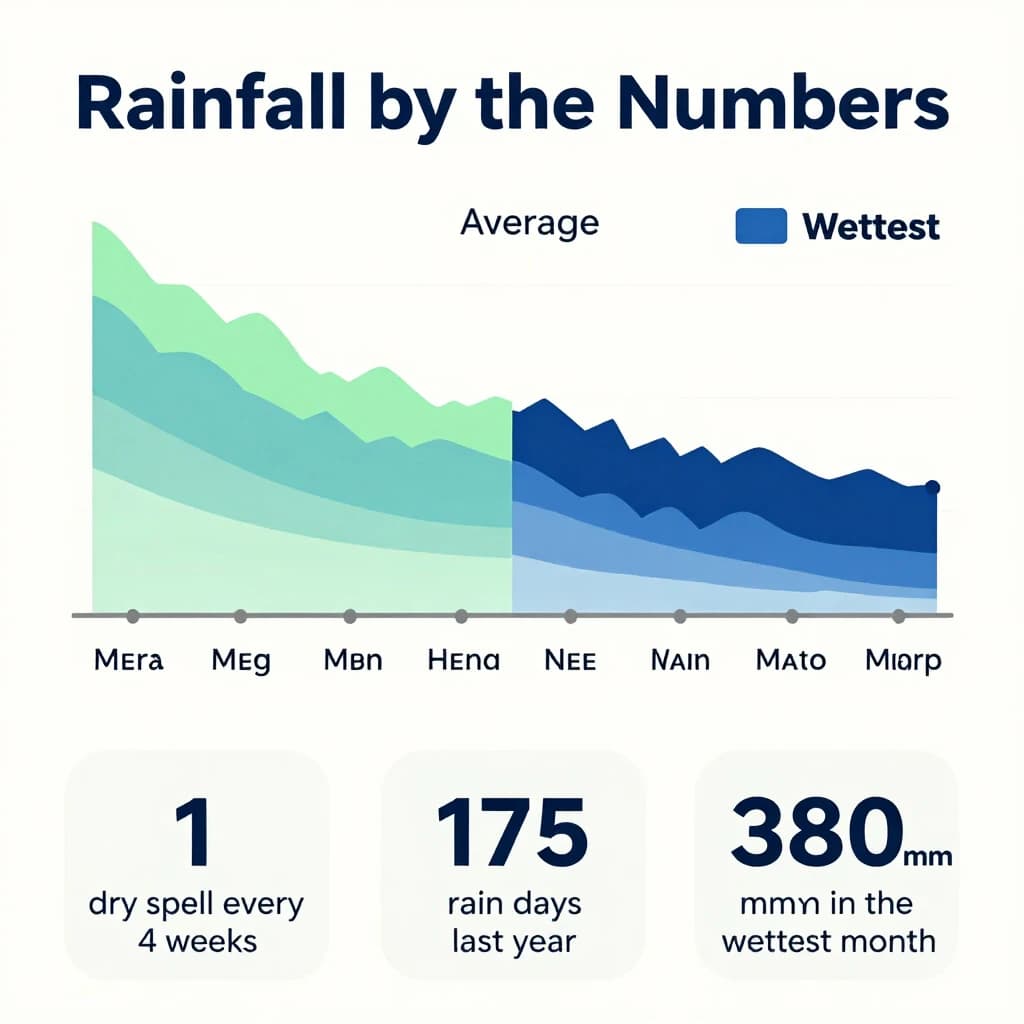 Z-Image Turbo, Runware3.0초
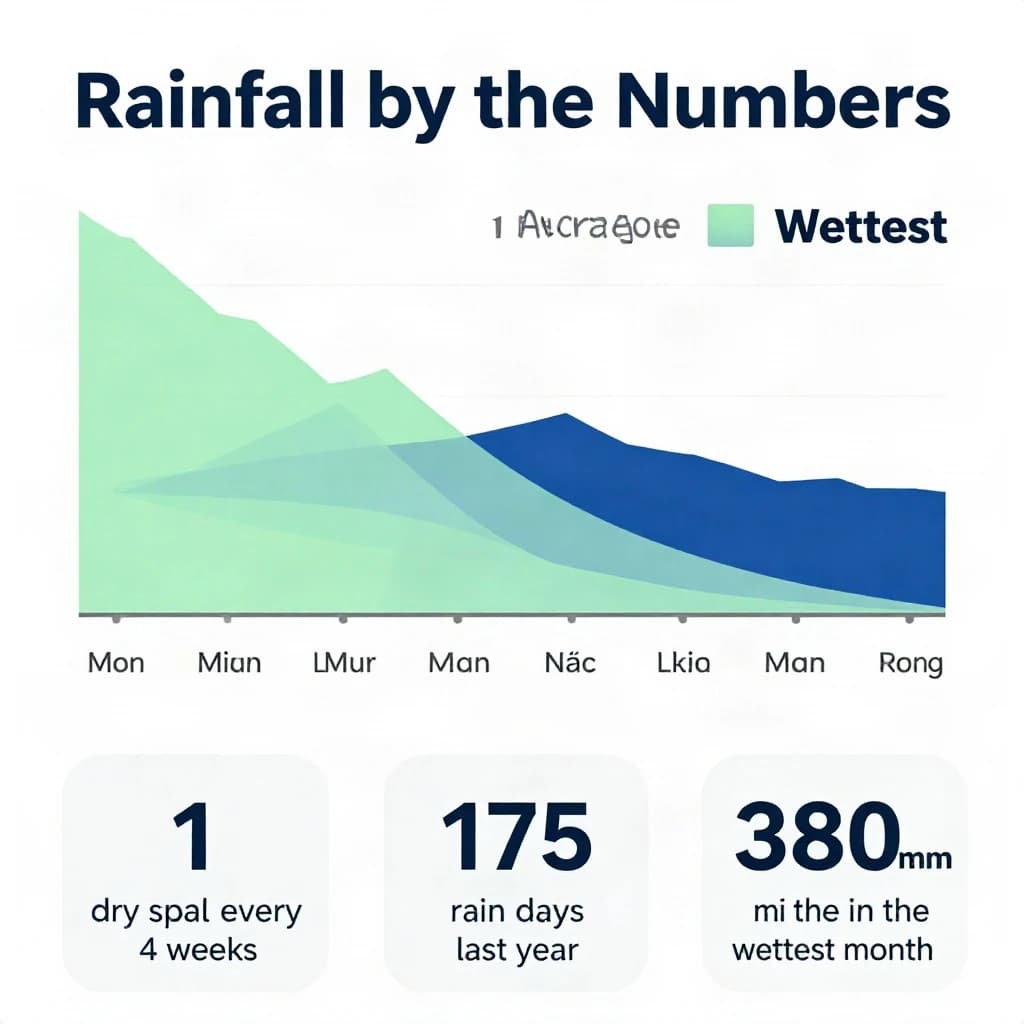 Z-Image Turbo, fal.ai3.3초