System Load Test (AA-SLT) Methodology
Overview
The benchmark measures system performance by maintaining fixed numbers of parallel queries sent to the system during the testing phase. Once each individual query finishes, another query is immediately sent to the machine. This ensures the system is benchmarked at a stable load while also minimizing test variance.
The aggregate amount of tokens received from the system during each phase is measured, and contributes to our system output throughput metric. Per-query performance is also measured, and these contribute to our per-query metrics (usually represented as a median or mean).
The benchmark is conducted using a phased approach. Each benchmarking phase is conducted for 3 minutes, and the number of concurrent queries is scaled with each subsequent phase. The benchmarking continues until the system's output throughput ceiling is reached, meaning that with higher concurrency, no additional extra tokens are received compared to prior periods.
Key Technical Specifications
- Phase duration: Each phase lasts 3 minutes (excluding ramp-up and cool-down periods).
- Concurrency levels: 1, 2, 4, 8, 16, 32, 64, then in increments of 64 until the system output throughput ceiling plateaus.
- Workload shape: 1,000 input tokens and 1,000 output tokens per query.
- Streaming: Benchmarking is conducted with streaming enabled.
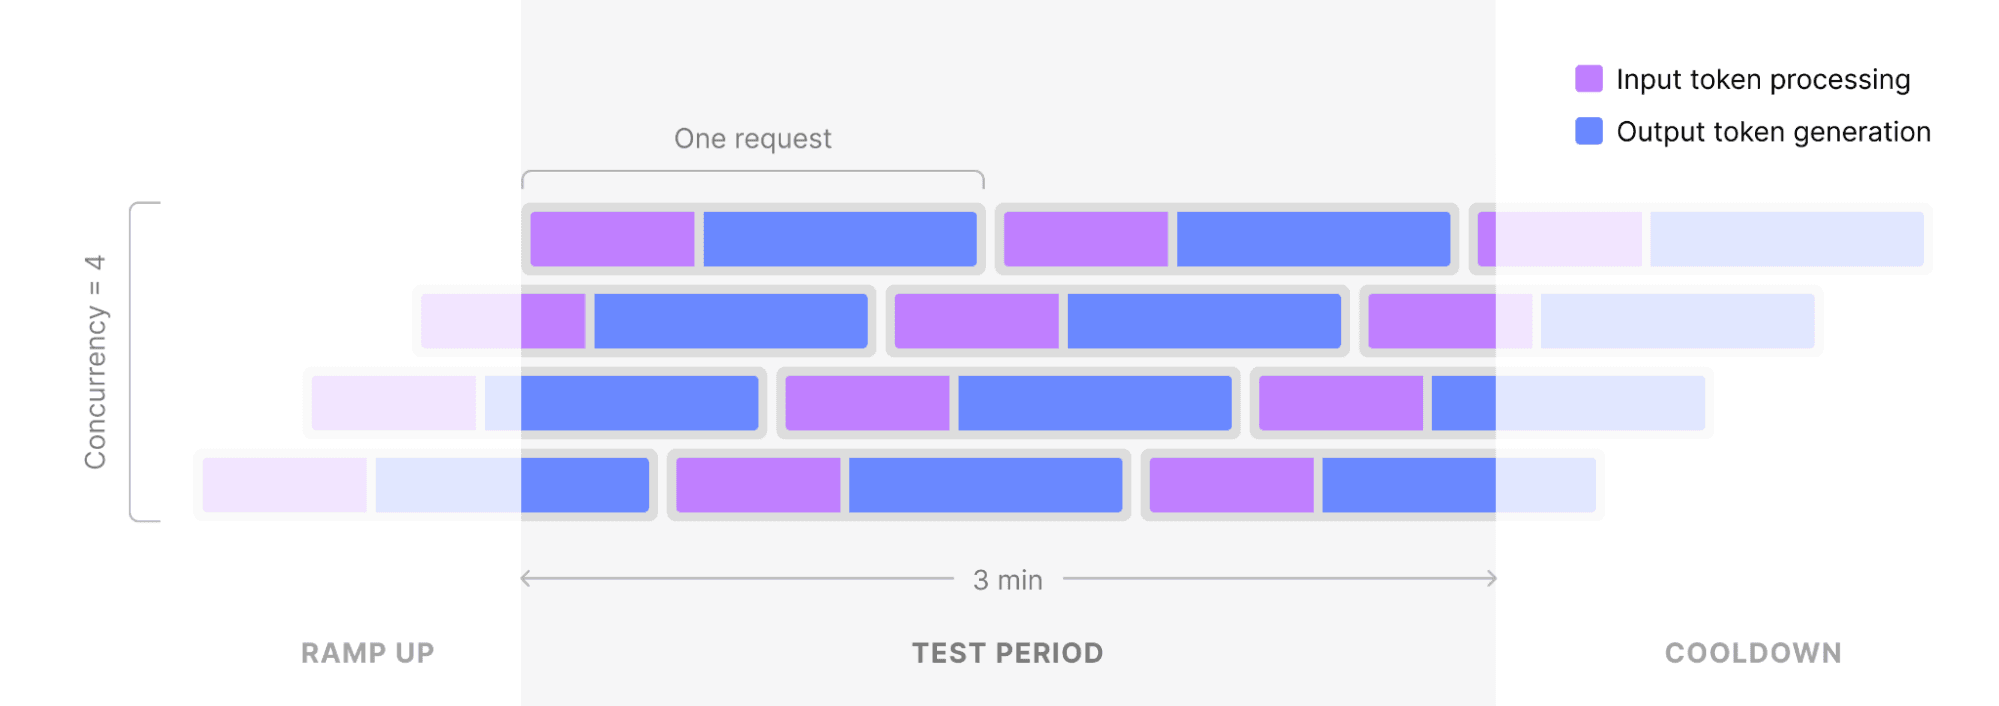
Artificial Analysis System Load Test (example with 4 concurrent requests)
Key Metrics Measured
- System Output Throughput: The average aggregate output tokens per second across all concurrent requests over the benchmarking phase.
- Response rate: The proportion of queries sent during the benchmarking phase that received responses (at least 1 output token).
- End-to-End Latency per Query: The end-to-end response time for each query from the time the query is sent. Figures are reported as the median of each concurrency phase.
- Output Speed per Query: Output tokens per second after the first token is received for each query. Figures are reported as the median of each concurrency phase.